Installing the ELK (Elasticsearch & kibana) and Send Logs by (file-beat , winlog-beat and fluent-bit)

Lab Introduction:
what is ELK :
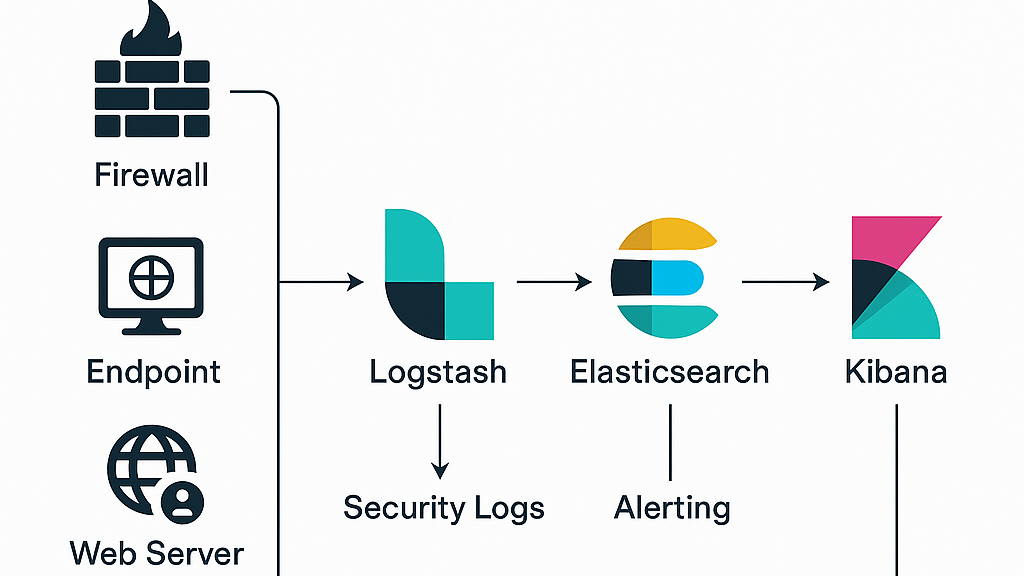
ELK SIEM refers to the Elastic SIEM solution, which is a Security Information and Event Management (SIEM) tool built on top of the Elastic Stack (formerly ELK): Elasticsearch, Logstash, and Kibana. It provides security teams with tools for threat detection, hunting, and response by collecting, processing, and analyzing security logs and event data from various sources in real-time
Core features:
- Threat detection: Offers pre-built detection rules aligned with the MITRE ATT&CK framework to identify suspicious activities and potential threats.
- Real-time monitoring: Provides real-time analysis of logs to detect and alert on suspicious behavior as it happens.
- Interactive investigations: Includes features like interactive timelines to help security analysts investigate incidents quickly.
- Host and network analysis: Offers tools for analyzing host and network data to identify anomalies and threats.
- Customization: Is highly customizable, allowing security teams to tailor detection rules and dashboards to their specific needs.
- Integration: Seamlessly integrates with a wide range of data sources, including firewalls and cloud services.
in simple details:
In this lab
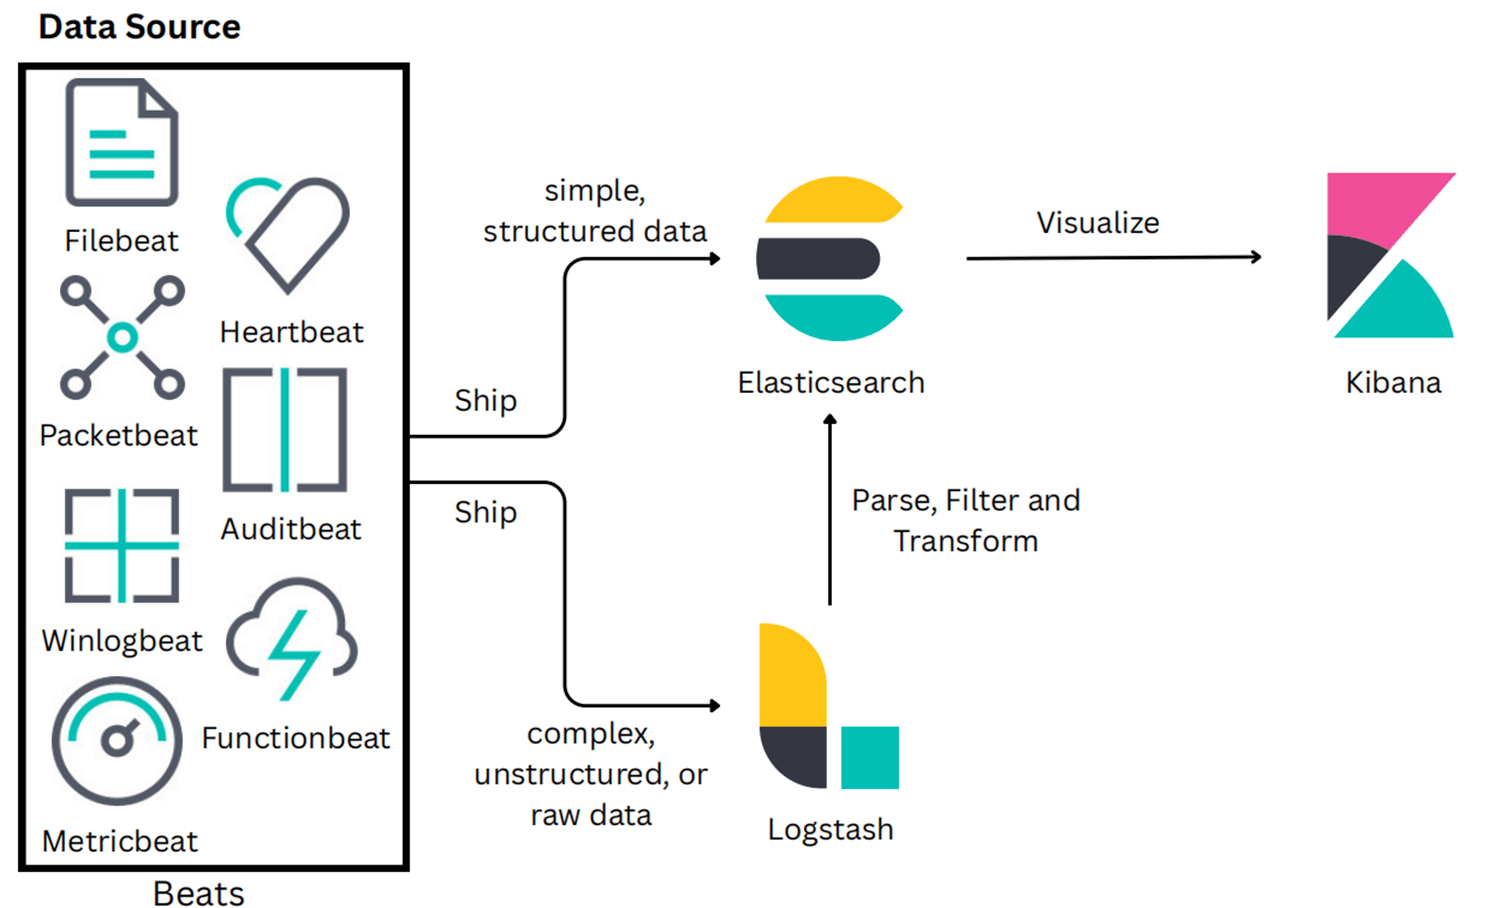
his lab focuses on building a functional SIEM environment using the ELK Stack. We will configure Elasticsearch, Logstash, and Kibana to visualize and analyze logs in real time. Then, we will set upFilebeat, Winlogbeat, and Fluent Bit to send logs from multiple systems and verify the data flow through the ELK.
First, Before deploying the ELK Stack, we need to set the machine’s IP address to static to make it easier to apply and use the ELK Stack
- Open
Settingsin Ubuntu. - From the bar, select
Wired Connected then Wired Settings. - Under the Wired section, click the Setting icon next to your connected network.
- A network settings window will appear:
- Go to the IPv4 tab.
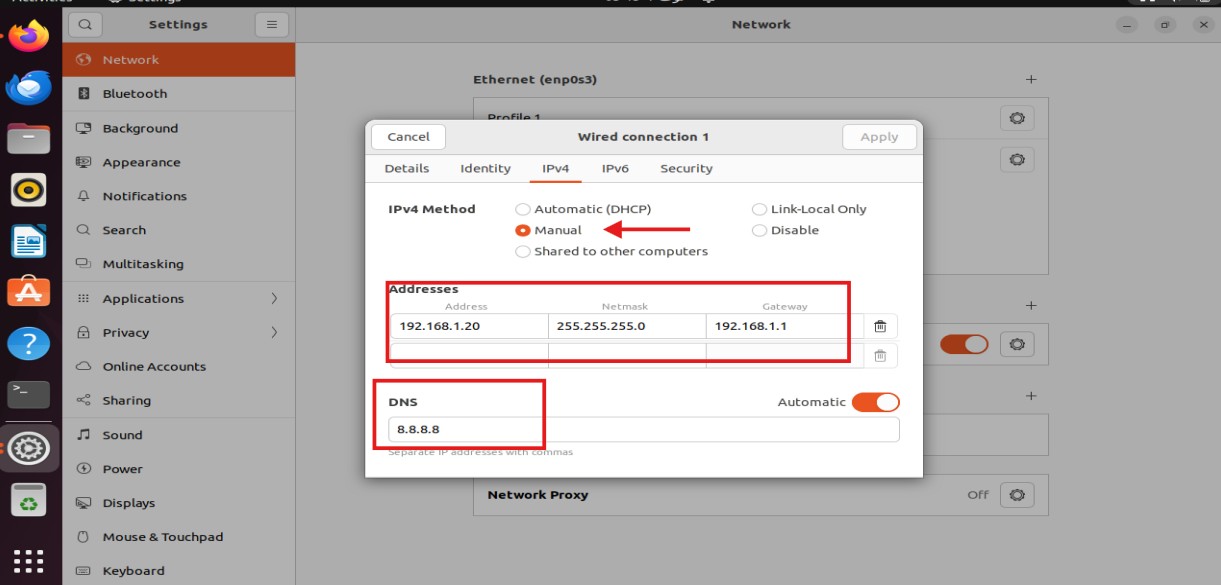
- Change IPv4 Method from Automatic (DHCP) to Manual
- Fill in the fields that appear:
- Address: Enter the static IP you want :
192.168.1.20. - Netmask:
255.255.255.0 or/24 - Gateway: Enter the Gateway (usually your router :
192.168.1.1). - DNS: Enter the DNS you prefer (Google: 8.8.8.8 or you can make it automatic)
- Address: Enter the static IP you want :
- Click
Apply. - Restart the Network or machine. as we can see below:
then We need to install and configure the ELK :
you can visit the original documentation of deploying and Install Elasticsearch with a Debian package by this link:
Documentation of Install Elasticsearch with a Debian package
first, we need Import the PGP Signing Key Elastic signs all its packages for security:
wget -qO - https://artifacts.elastic.co/GPG-KEY-elasticsearch | sudo gpg --dearmor -o /usr/share/keyrings/elasticsearch-keyring.gpg
to Ensure the packages downloaded from Elastic are authentic and officially signed. The resulting elasticsearch-keyring.gpg will serve as the signing key for apt.
then we need to Install from the APT repository, then Add the Elastic Repository by Install required package:
sudo apt-get install apt-transport-https to allows apt to use https.
then Save the repository definition in : /etc/apt/sources.list.d/elastic-9.x.list by using this command :
echo "deb [signed-by=/usr/share/keyrings/elasticsearch-keyring.gpg] https://artifacts.elastic.co/packages/9.x/apt stable main" | sudo tee /etc/apt/sources.list.d/elastic-9.x.list to add Elastic repository in a separate file for cleanliness instead of editing.
All of this can be seen below: 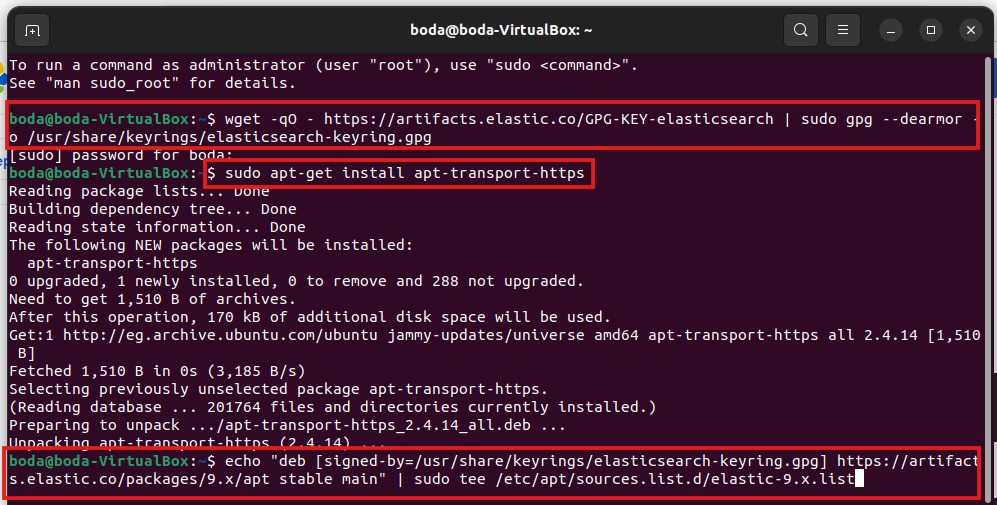
then we need Make Update and install Elasticsearch by using this command :
sudo apt-get update && sudo apt-get install elasticsearch
as we can see below: 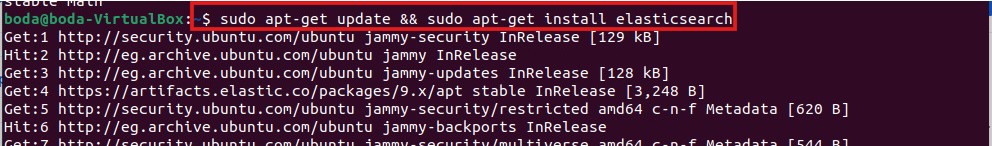
After installation done , Pulls new metadata from the repo and installs the elasticsearch package you will see: 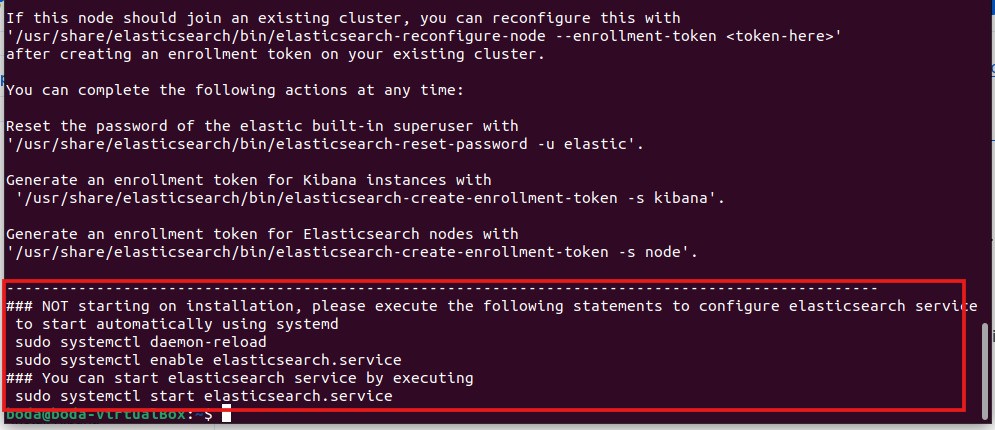
then we need to Configure Network of Elk for making the node is accessible from other machines by opening the config file: /etc/elasticsearch/elasticsearch.yml by using this command :
sudo nano /etc/elasticsearch/elasticsearch.yml 
Be careful: YAML is case sensitive so No extra letters or spaces.
Then the configurations and changes that we can make in the YAML file are:
- cluster.name:
elasticsearch-demothat must be the same across all nodes in the cluster - node.name:
node-1to use a descriptive name for the node - path.data :
/var/lib/elasticsearchthis is a path to directory where to store the data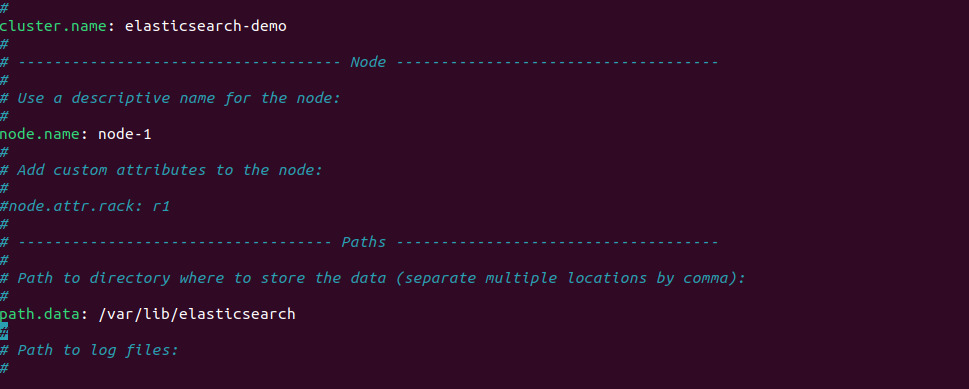
- network.host:
0.0.0.0to Allow connections from all networks and makes the node available to other machines. - http.port :
9200that the defualt port to connect with ElK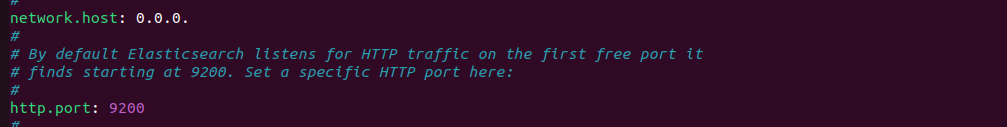
- transport.host:
0.0.0.0to allow communication between nodes. - discovery.type :
single-nodethis make the ELK that warks as a one node (standalone) - http.host :
0.0.0.0to allow http api connections from anywhere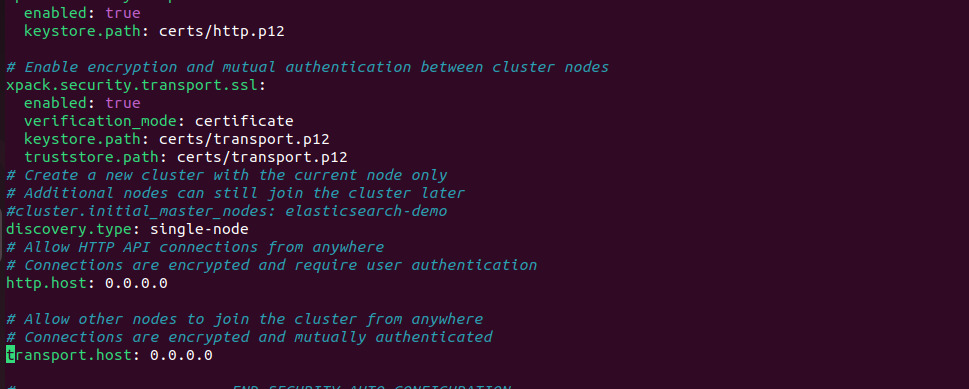
then we need to Run Elasticsearch as a systemd Service by these commands :
sudo /bin/systemctl daemon-reloadto Reload systemd to recognize the new servicesudo /bin/systemctl enable elasticsearch.serviceto Enable Elasticsearch service at bootsudo systemctl start elasticsearch.serviceto Start the serviceas we can see below:

Then we need to reset the elastic superuser password, since the original password was automatically generated and not displayed. This will allow us to access the Elastic service ,We can do that by changing directory to the following path:/usr/share/elasticsearch/bin Then we can find the script related to resetting the password, as shown below: 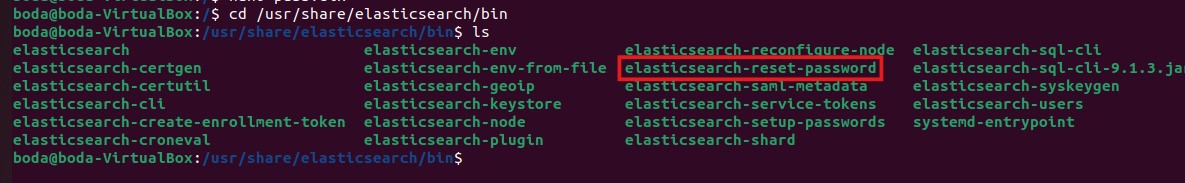
Then, to reset the password and generate a new visible value, we can use the following command:
sudo /usr/share/elasticsearch/bin/elasticsearch-reset-password -u elastic
After executing the command, the new password value will appear.
Then, it is recommended to store this new value in a new file to make it easier to use later , we use the following command to store the new value of password in the file : sudo nano pass.elk then we store the value in pass.elk file then save ctrl+o and exit ctrl+x as shown below: 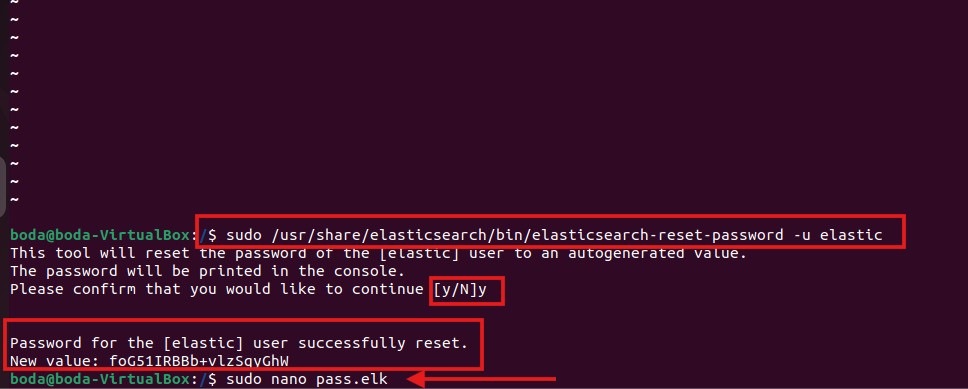
after that, we need to check if the Elasticsearch service is active and running effectivley or not by using the following command :
sudo systemctl status elasticsearch.service as shown below:
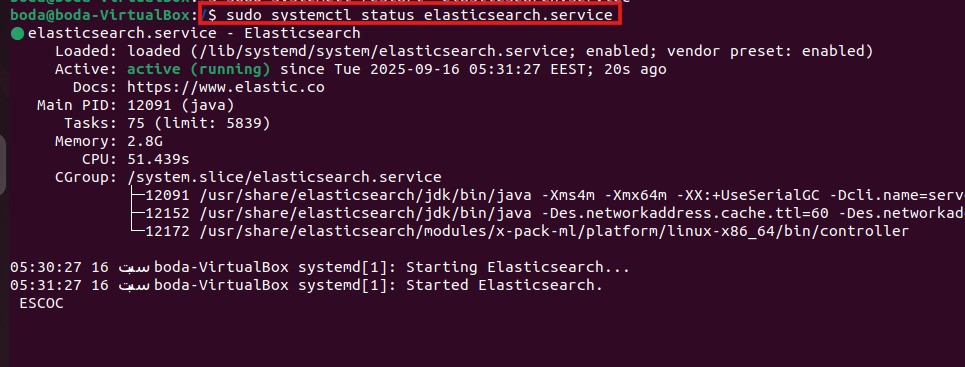 As we can see, the Elasticsearch service is active and running successfully without any issues.
Now, we can open Elasticsearch in a browser at https://localhost(ip of machine):9200 security is enabled by default, so it will ask for:
- user :
elastic - Password : the new value you set with elasticsearch-reset-password If you forget it, You can reset it again or retrieve it from the file where you stored the value, for example:
nano pass.elk
Then, Elasticsearch is running in the browser, and the first part has been completed as shown below : 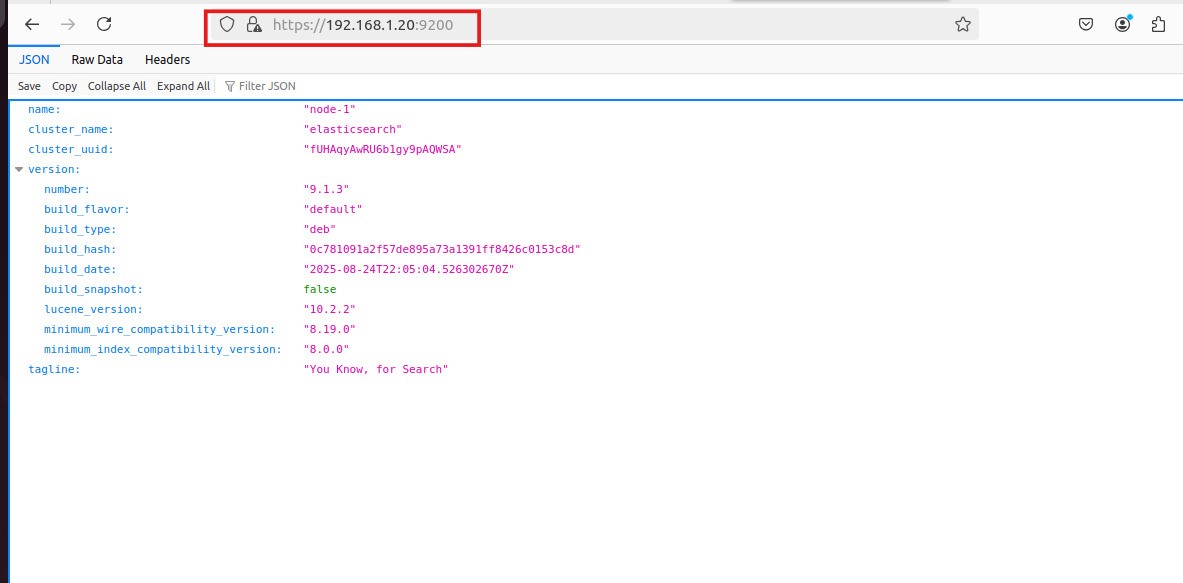
Setting Up Kibana
- Now, we will start setting up Kibana to visualize and manage the data collected by Elasticsearch, Kibana is the visual user interface for Elasticsearch
- kibana allows to :
- Visualize data in graphs and reports.
- Manage indices and Elasticsearch settings graphically.
- Monitor cluster performance and health.
- Create interactive dashboards.
- To set up Kibana, we need to configure its settings and connect it to the Elasticsearch instance.
Install kibana And Register Kibana with Elasticsearch you can visit the original documentation of deploying and Install:
visit the original documentation of deploying and Install kibana
The process is the same as the steps we followed when installing Elasticsearch,If you have already completed the first steps of Elasticsearch installation (Import the PGP Signing Key and APT repository) ,you don’t need to do them again
first, we need to Import the PGP signing key by using the following command :
wget -qO - https://artifacts.elastic.co/GPG-KEY-elasticsearch | sudo gpg --dearmor -o /usr/share/keyrings/elasticsearch-keyring.gpg
then we need to Install Kibana from the APT repository by using the following command : sudo apt-get install apt-transport-https to allows apt to use https
then Save the repository definition in echo "deb [signed-by=/usr/share/keyrings/elasticsearch-keyring.gpg] https://artifacts.elastic.co/packages/9.x/apt stable main" | sudo tee /etc/apt/sources.list.d/elastic-9.x.list
then we need to Make Update and install Kibana by using the following command :
sudo apt-get update && sudo apt-get install kibanaas shown below:
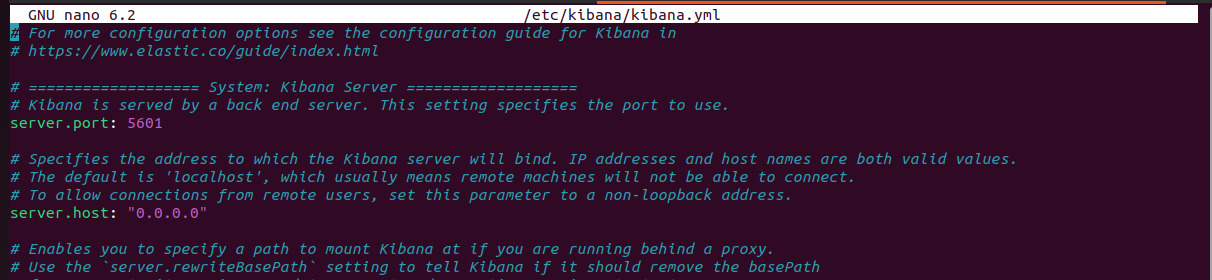
then we need to Configure Network of Kibana for Make Kibana accessible from outside the server by opening the config file: /etc/kibana/kibana.yml by using the following command: sudo nano /etc/kibana/kibana.yml
then we need to make some changes on server port uncomment it and ensure it is port = 5601 and server.host: localhost and change it to 0.0.0.0 since the localhost means Kibana listens only to connections from the same machine, but not useful if you want to access Kibana UI from another computer on the network , but changing to 0.0.0.0 means “listen on all IP addresses on this server.” This allows any device on the network that can reach this IP to try connecting to Kibana then save and exit as we can see below:
then we need to Create an "Enrollment Token" for Kibana this is step very important for Security that Starting from version 8.x, Elasticsearch and Kibana are secured by default,Kibana cannot connect to Elasticsearch by IP alone, Explanation: This token is like a secure entry ticket or invitation It contains all the cluster’s security configuration (TLS certificate info) It allows Kibana to connect and register with this specific cluster Grants permissions to the built-in kibana_system account inside Elasticsearch to act on behalf of Kibana it is Valid for only 30 minutes for security reasons, then we can create this token by using the following command :
sudo /usr/share/elasticsearch/bin/elasticsearch-create-enrollment-token -s kibana or sudo ./elasticsearch-create-enrollment-token -s kibana if you are in the path /usr/share/elasticsearch/bin/ as we can see below:
 Then, the token value appeared, Copy this value and save it in an external file to make it easier to use later, just as we did with the Elasticsearch password by using the folloing command :
 sudo nano kibana.token Then, the new file will be opened. Paste the token value, then save and exit.
then we need to Run Kibana as a systemd service just as we did with the Elasticsearch, to creates a symbolic link so the service starts automatically when the system boots, no need to start it manually every time , by using these following commands:
sudo systemctl daemon-reloadsudo systemctl "enable" kibana.service- After that we need to Start the Kibana service:
sudo systemctl start kibana.service - then we need to check if the Kibana service is active and running effectivley or not by using the following command :
sudo systemctl status kibanaas shown below: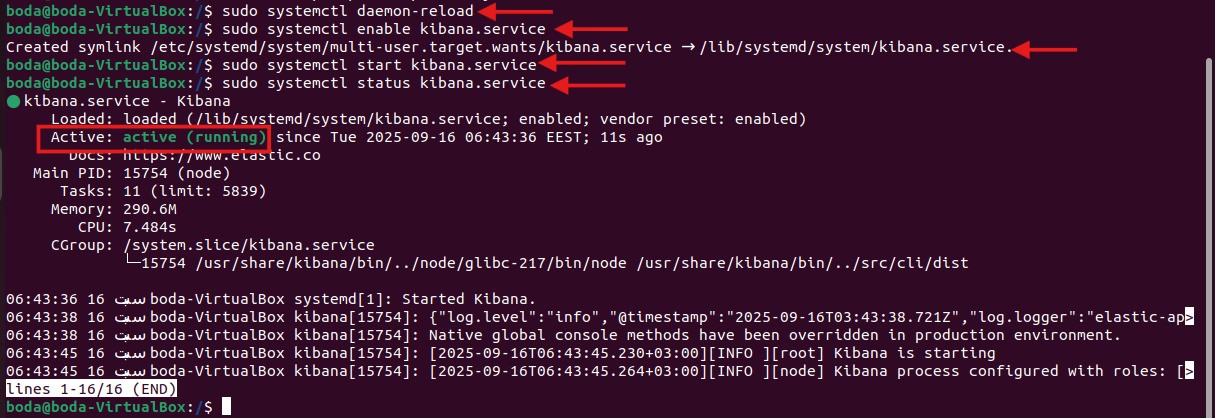
Then, we need to register Kibana with Elasticsearch by Getting the verification code from the status of kibana:
sudo systemctl status kibana as shown below: 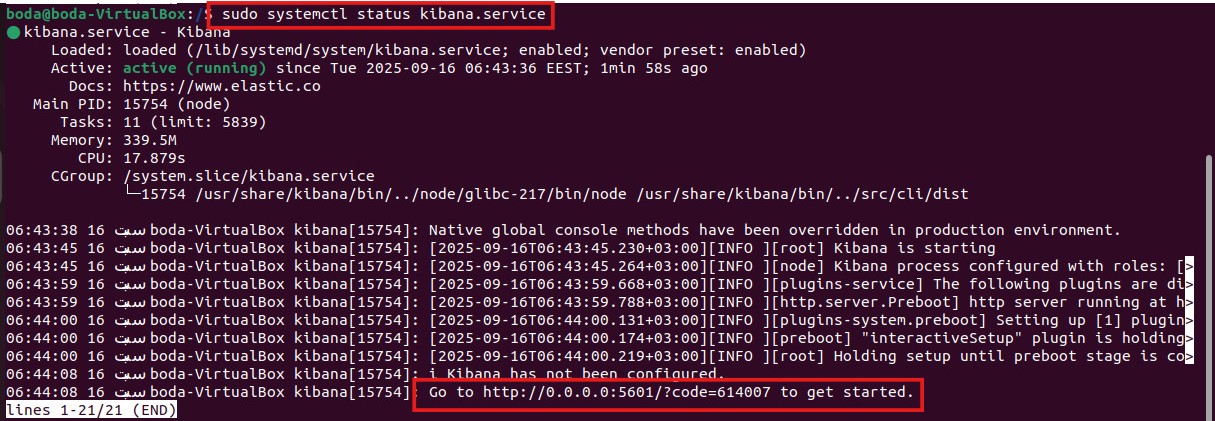
Use the link shown in status http://<host-ip>:5601/?code=<code> EX : http://192.168.1.20:5601/?code=614007
When we open this link in our browser, it asks us to enter the Kibana enrollment token that we have just generated and saved in the kibana.token file as shown below :
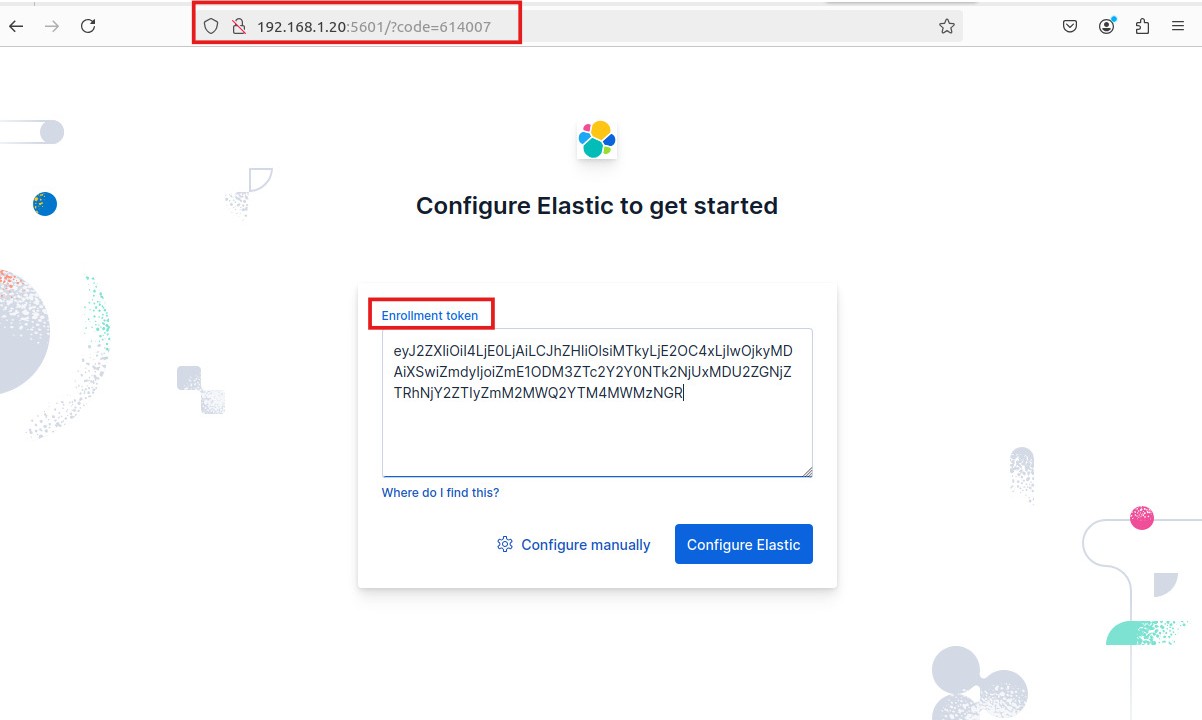
NOTE!!!: If a problem occurs ( Token Of kibana expires every 30 minutes), we need to create a new one and repeat steps:
After the configuration is completed, we can open the same link again. It will redirect us to the (Kibana & Elasticsearch login page) , where we need to enter the (username and password) of the Elasticsearch user that we generated during the setup and configuration process and the Password that we saved in the pass.elk file as showen Below : 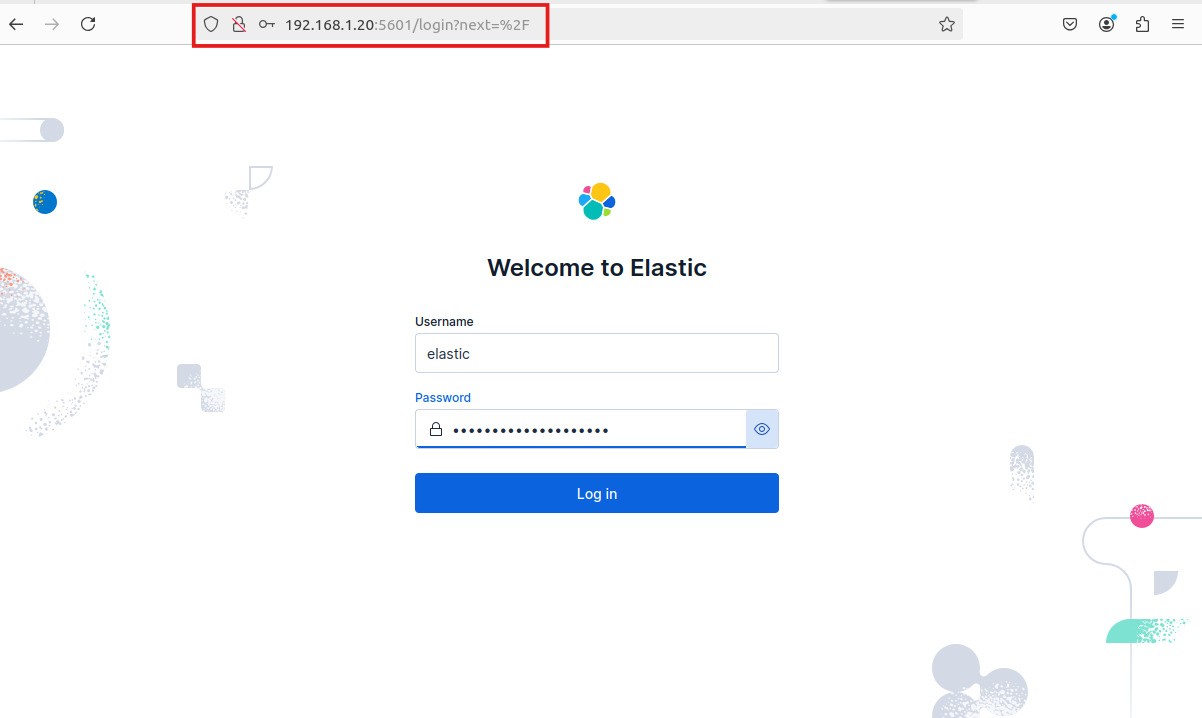
After logging in successfully we can access the Home Page as we see show below: 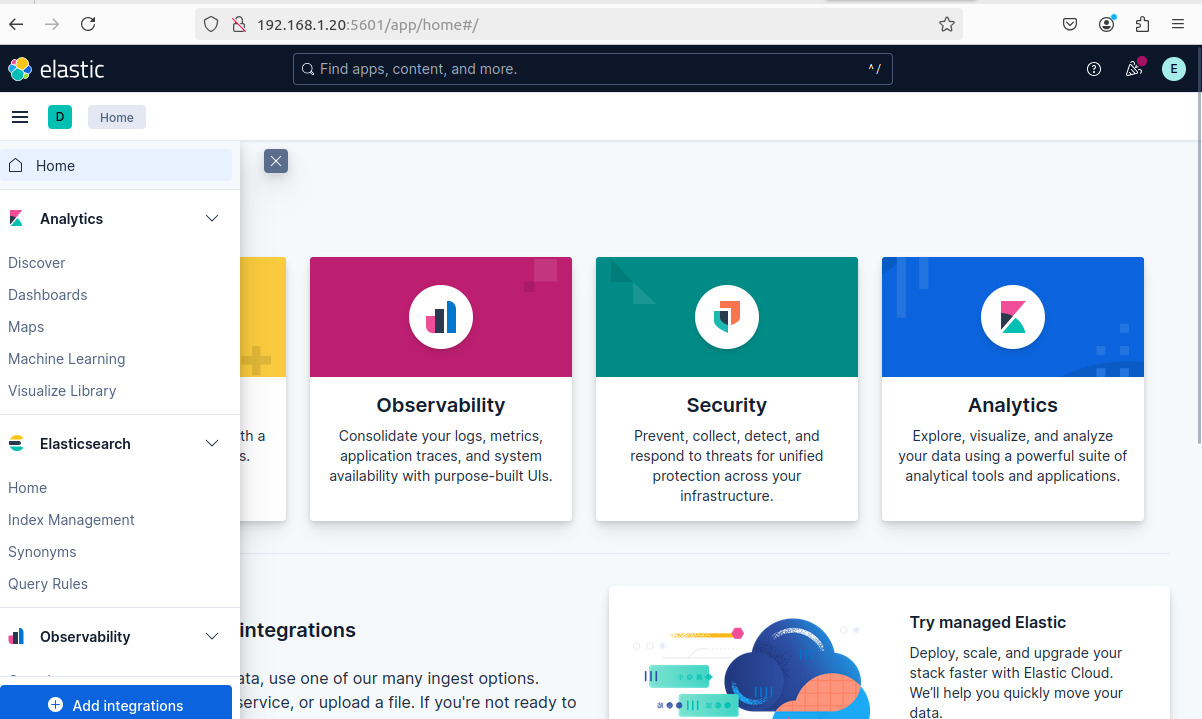 now, we can access the Kibana dashboard, From this point, we can start sending logs from other machines to Elasticsearch in order to visualize and analyze them through Kibana’s dashboards and visualization tools.
Setting up Filebeat to Send Logs to Elasticsearch from a Linux Machine
- Now, we will start setting up Filebeat to collect and forward logs to Elasticsearch, Filebeat is a lightweight log shipper that monitors log files and sends their content to Elasticsearch for analysis.
- Filebeat allows you to:
- Collect logs from different sources automatically.
- Forward system, application, and custom logs securely.
- Integrate easily with Elasticsearch and Kibana for visualization.
- Reduce overhead on the system with its lightweight design.
To set up Filebeat, we need to install it, configure its YAML file, and connect it to our Elasticsearch instance to start sending logs.
Install Filebeat and send Logs to Elasticsearch you can visit the original documentation of deploying and Install:
visit the original documentation of deploying and Install filebeat
First, we need to Download Filebeat Files on our machine from this Link Download Filebeat then Choose the package based on Type of your machine’s operating System, Here, in our case, we will send the logs from an Ubuntu machine, so we will choose the package type deb x86_64, and then proceed with the download and installation steps as shown below: 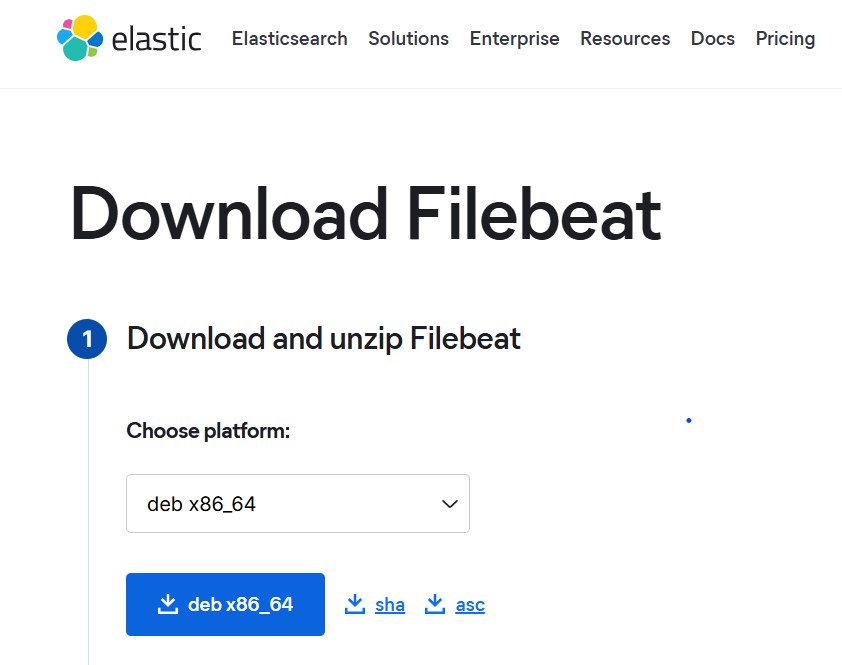
Then, after the installation, Filebeat will be located in the directory you chose — in our case, it will be in the Downloads folder. Next, we need to set it up on our machine using the following command:
sudo apt install ./filebeat-9.1.3-amd64.deb as shown below : 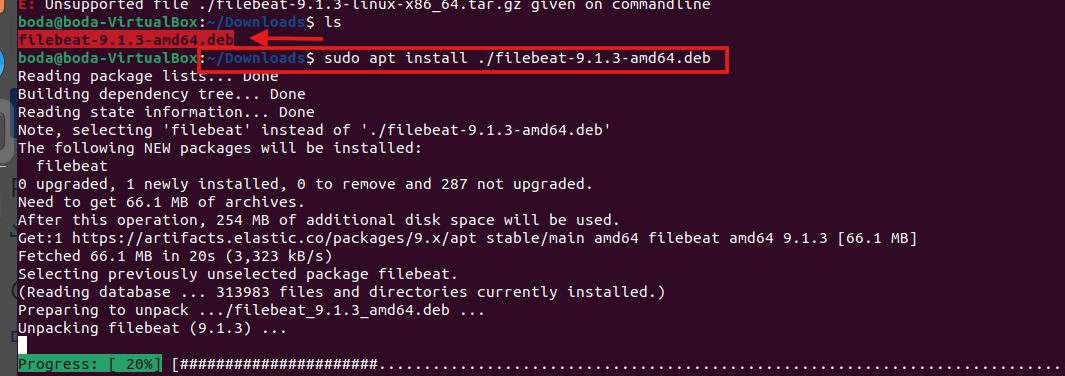
Then, we need to open the Filebeat configuration file by using the following command :
sudo nano /etc/filebeat/filebeat.yml to make some changes such as setting the hosts, protocol, and authentication credentials under the Elasticsearch output section. This configuration allows Filebeat to connect to Elasticsearch and forward logs to it , So, after opening the configuration file, we need to set the value of hosts: [IP of Elasticsearch:port of elastic], which in our case ishosts: [192.168.1.20:9200] ,then set the value of protocol: "https" and add the following line under the HTTPS protocol:ssl.verification_mode: none :
- because we are using a local lab environment and Elasticsearch has a self-signed certificate ,If we don’t disable SSL verification, Filebeat will not be able to connect and will give an error , so in production environments it’s better to keep SSL verification enabled for security reasons.
Then,we need to set the authentication credentials by entering the Elasticsearch username and password that we generated earlier,, as we can see all of these below : 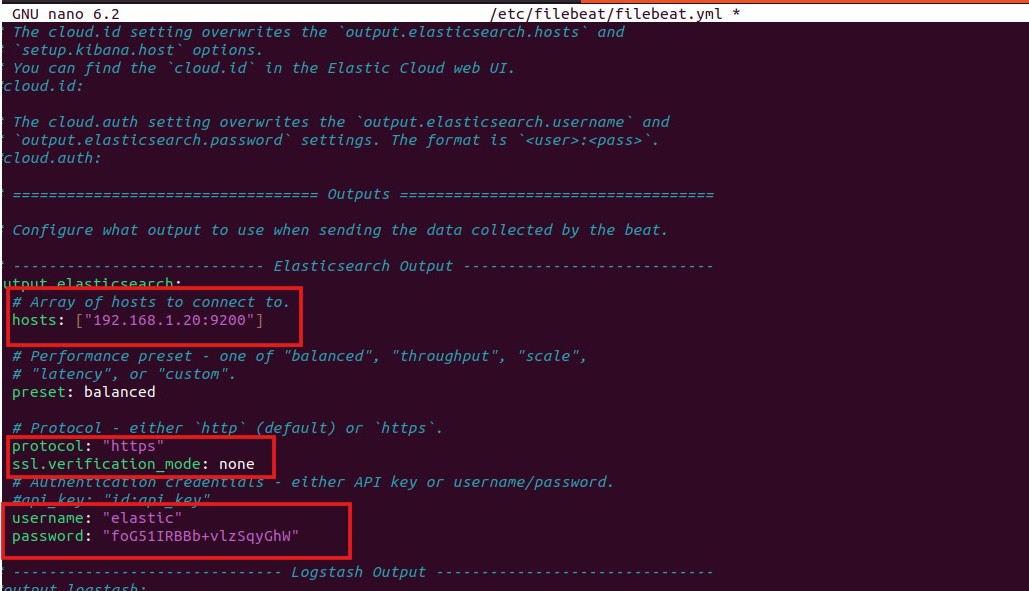
After we finished from the Elasticsearch output section, we also need to make some changes such as setting the hosts and setup.kibana under the Kibana output section, to connect to Kibana and visualize the logs , so we we need to uncomment the setup.kibana and set the value of hosts:[ip of Elasticsearch:port of kibana] , which in our case is hosts: [192.168.1.20:5601],, as we can see all of these below: 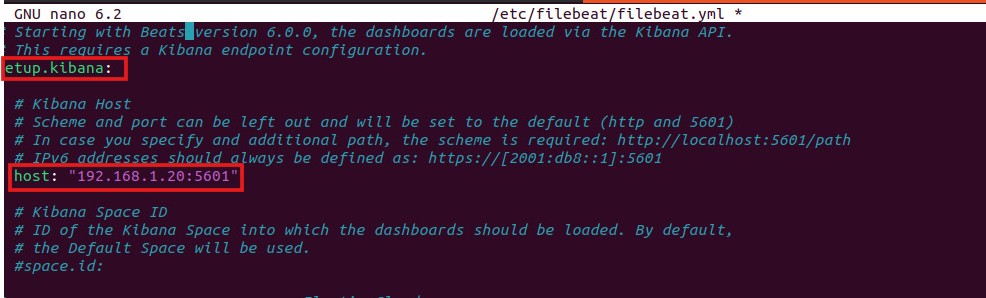
then we need to open the Filebeat module configuration file for Elasticsearch located at /etc/filebeat/modules.d/elasticsearch.yml. by using the following command : sudo nano /etc/filebeat/modules.d/elasticsearch.yml
and we enabled the server log section by setting the value of enabled to true This configuration allows Filebeat to collect and forward the Elasticsearch server logs, such as (errors, warnings, and operational activities), to Elasticsearch or Kibana for further analysis and visualization, if this option was set to false, Filebeat would not collect any server logs from Elasticsearch. as we can see below : 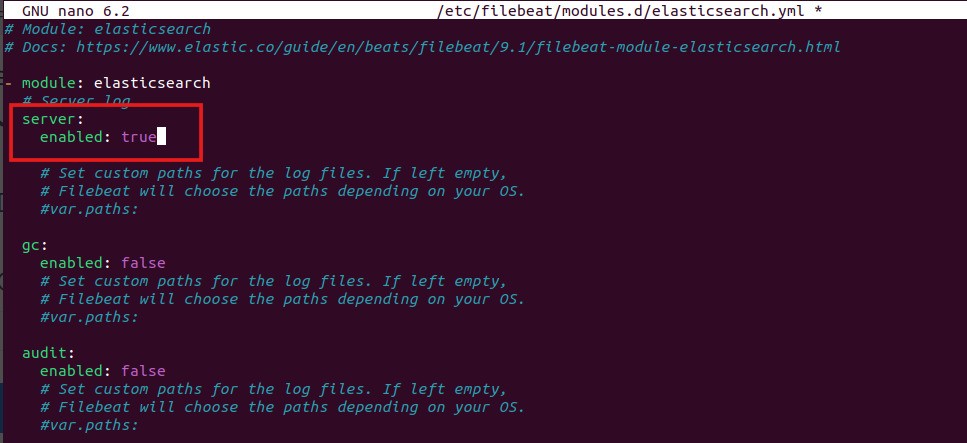 In the same way, you can enable other sections such as:
 gc: enabled: true ,, audit: enabled: true
- gc (Garbage Collection): When enabled, it allows you to monitor Elasticsearch’s memory cleanup process, helping identify potential performance or memory issues.
- audit: When enabled, it activates audit logging, which records security-related events like user logins, access attempts, and changes — useful for tracking and investigating system activity.
Then we need to enable the Elasticsearch module in Filebeat by using this following command :
sudo filebeat modules enable elasticsearch as we can see below :  this command activates the module responsible for collecting and sending Elasticsearch logs to Elasticsearch/Kibana for analysis , so By running this command, we tell Filebeat to start using the Elasticsearch module, which automatically knows:
- Where to find the Elasticsearch log files.
- How to parse and structure those logs.
- How to load the related Kibana dashboards for easy visualization.
then, we need to test the Filebeat configuration and output to ensure that everything is set up correctly and working as expected by using the following commands : sudo filebeat test config and sudo filebeat test output as we can see below: 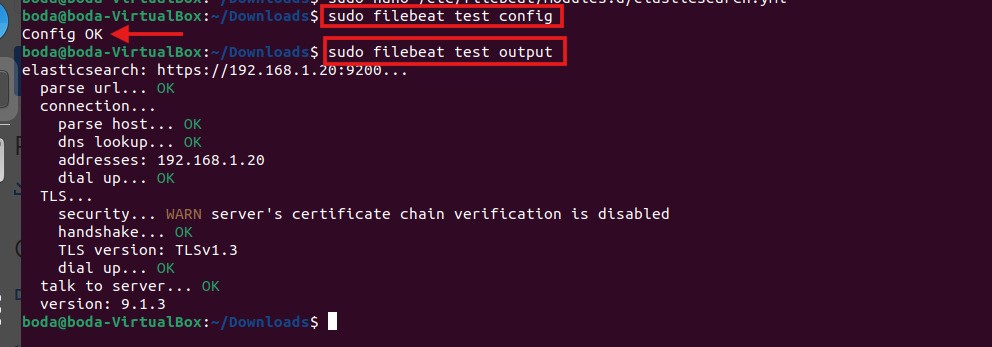 So, we can see that everything is OK.
Finally, we need to start the Filebeat service, so it can run, collect logs, and send them to Elasticsearch by using the following command :
sudo systemctl start filebeat.service and using the following command sudo filebeat setup -e to make Filebeat display the setup logs and progress directly in the terminal instead of saving them to the log file before sending it to Elasticsearch and Kibana,, as we can see all of these below: 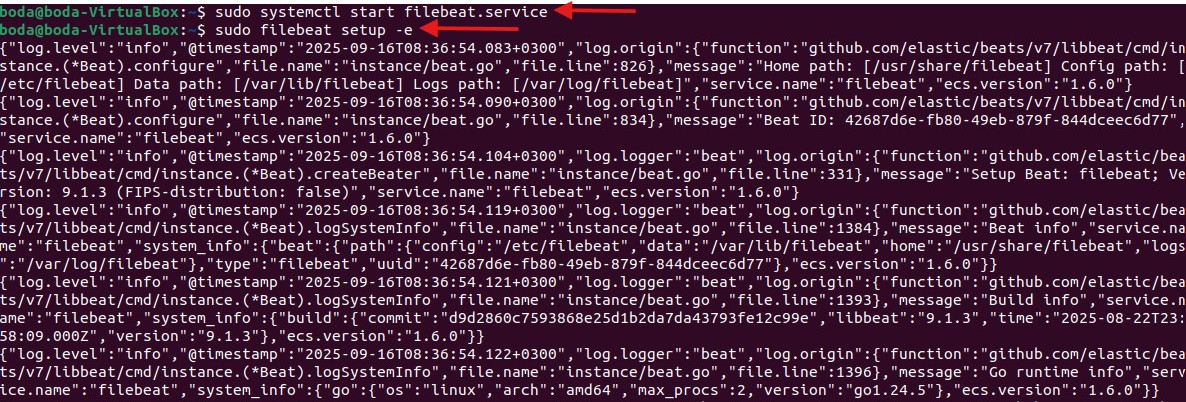
Now, we can access our Elasticsearch and Kibana in the browser through https://192.168.1.20:5601 to view the logs that were sent from the Ubuntu machine using Filebeat,,after logging into Kibana, navigate to the left sidebar and under the “Analytics” category, select “Discover” then, choose “filebeat” from the data view to explore and analyze the collected logs, so the steps to view logs is Analytics -> Discover -> data view -> filebeat as we can see all of these below : 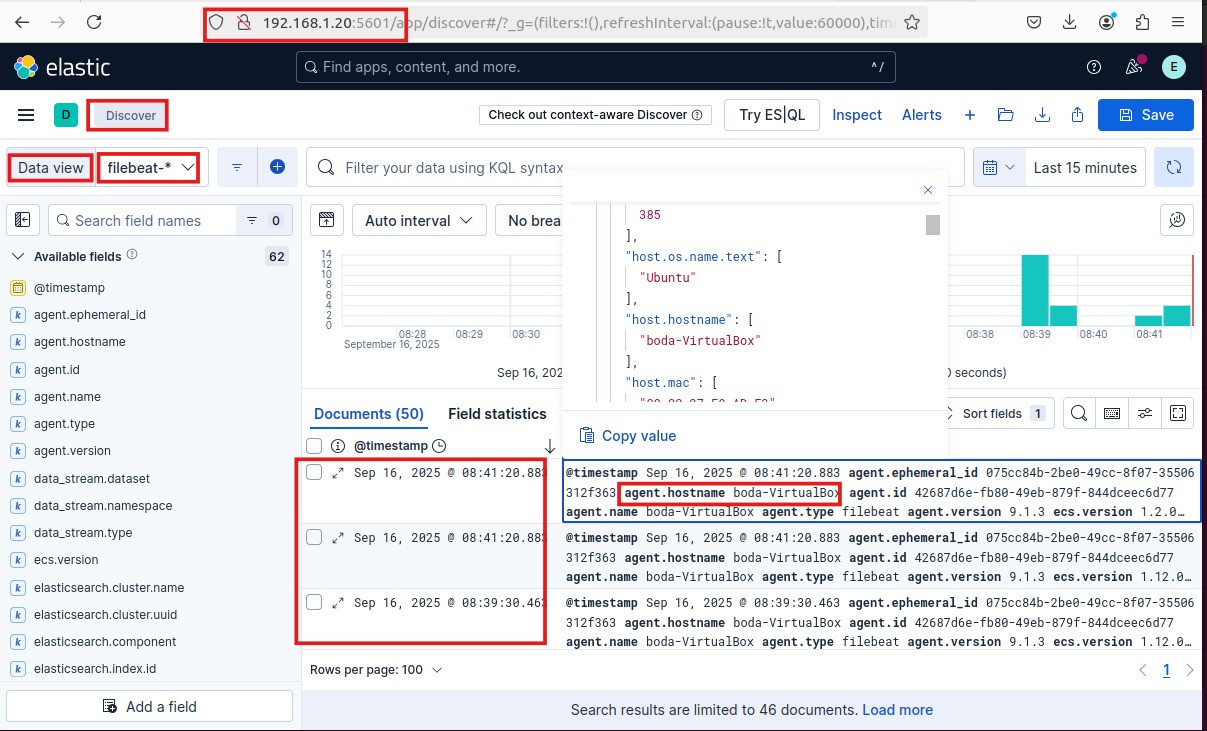
Now, we can see that everything is working correctly, and the machine logs were successfully sent to the SIEM (Elasticsearch). We can easily view, analyze, and monitor these logs through Kibana.
Setting up Winlogbeat to Send Logs to Elasticsearch from a Windows Machine
Now, we will start setting up Winlogbeat to collect and forward Windows event logs to Elasticsearch. Winlogbeat is a lightweight Windows event log shipper that monitors system, security, application, and custom event channels, then sends their data to Elasticsearch for analysis.
Winlogbeat allows you to:
- Collect Windows event logs automatically from multiple channels.
- Forward security, system, application, and custom event logs securely.
- Integrate seamlessly with Elasticsearch and Kibana for visualization and monitoring.
- Reduce system overhead due to its lightweight and efficient design.
To set up Winlogbeat, we need to install it on the Windows machine, configure its YAML file, and connect it to our Elasticsearch instance to start sending event logs
Install Winlogbeat and send Logs to Elasticsearch you can visit the original documentation of deploying and Install:
visit the original documentation of deploying and Install winlogbeat
First, we need to Download Winlogbeat Files on our machine from this Link Download winlogbeat then Choose the package based on your machine, Here, in our case, we will send the logs from an 64x windows machine, so we will choose the package type Windows ZIP x86_64, and then proceed with the download and installation steps as shown below: 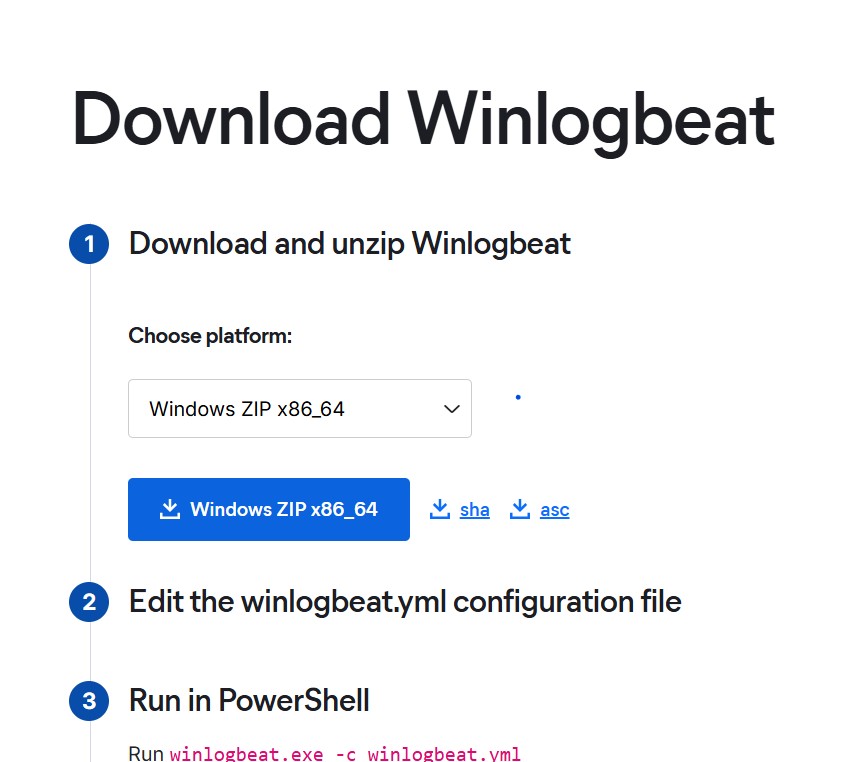
Then, after the installation, Winlogbeat will be located in the directory you selected — in our case, it will be inside the Downloads folder. Before setting up and configuring Winlogbeat, we need to make some changes on the Windows machine, such as renaming the machine and enabling specific local audit policies. These audit policies will allow the system to generate the necessary security and activity logs, which Winlogbeat will later collect and forward to Elasticsearch.
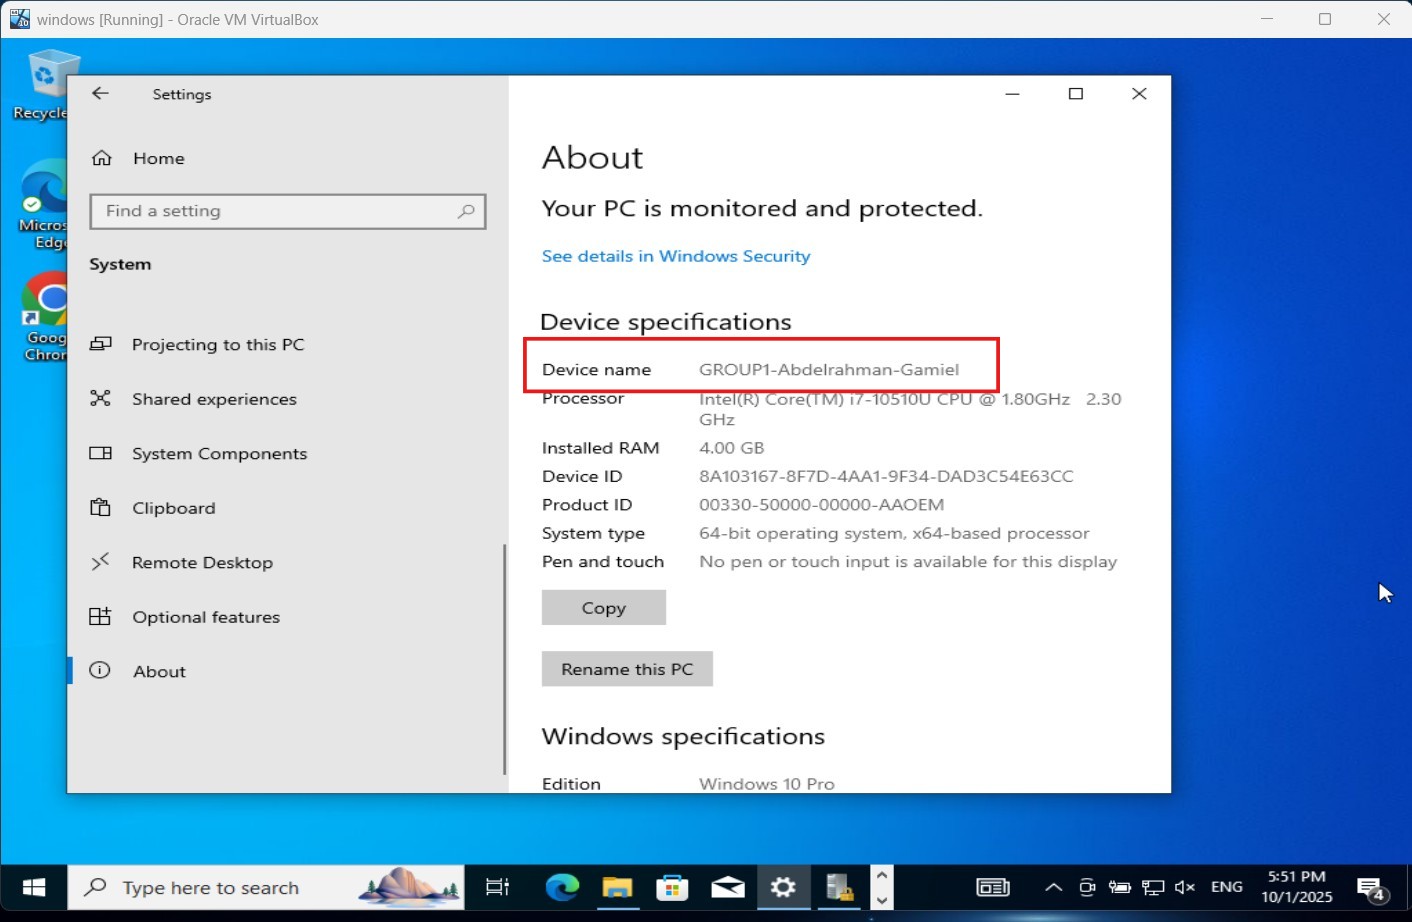
So, we can change the PC name by going to: Settings → System → About → Rename this PC, then enter the new name you want. On a Windows Server machine, you can change the computer name from: Local Server → Computer Name → Change, and then enter your desired name, in my case i will change to my name as we can see below :
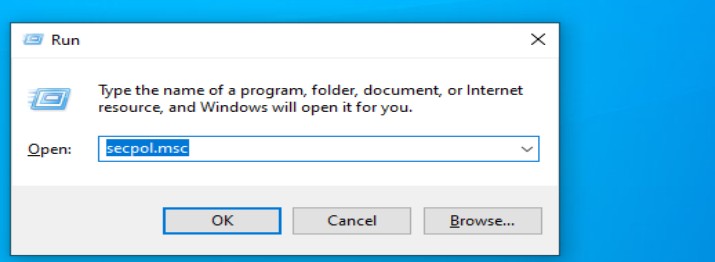
Then, we need to add local audit policies to the Windows machine. First, press Windows Logo + R to open the Run window, and type “secpol.msc” to open the Local Security Policy with all security setting as we an see below :
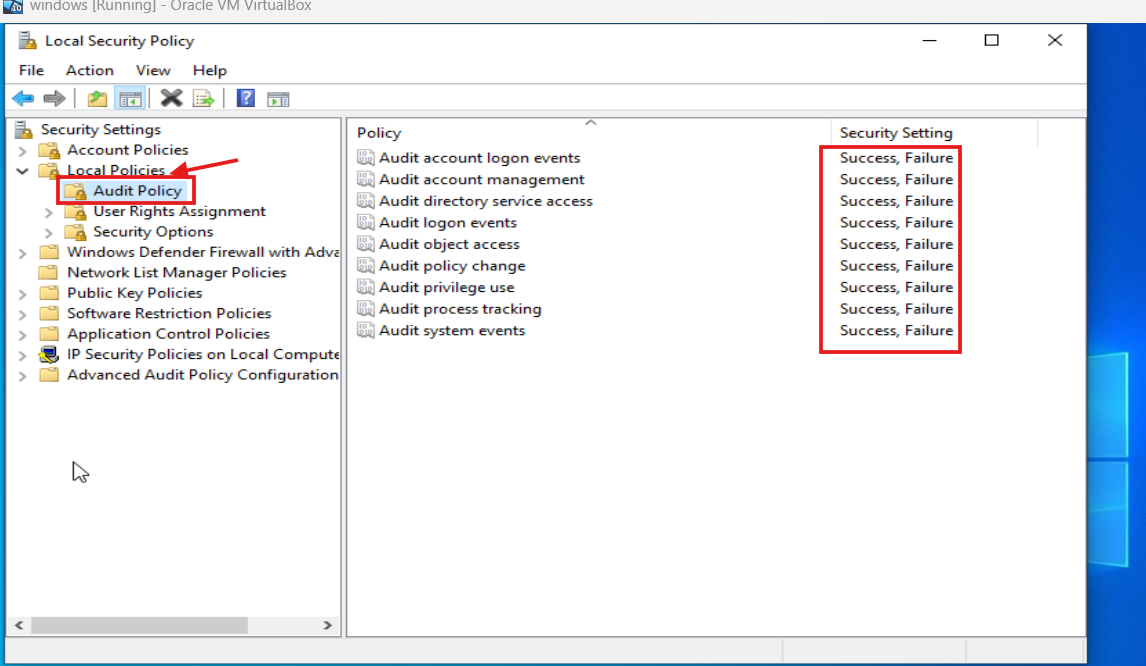
Then, select “Local Policies”, and you will find a list called “Audit Policy.”` Open this list, choose the audit policies you want to enable, and configure them according to your requirements as we can see below:
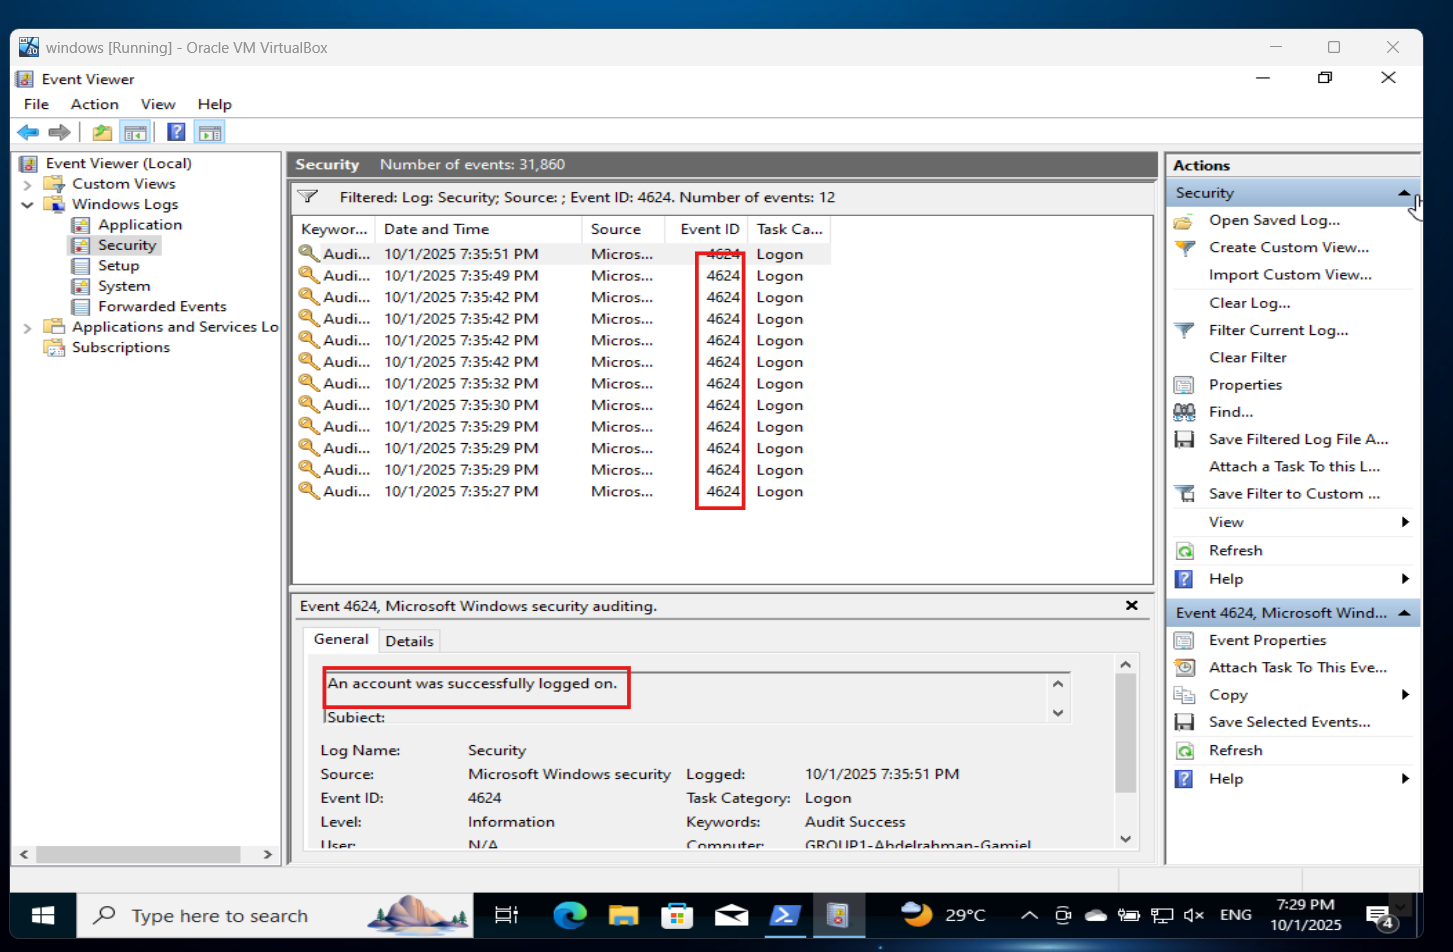
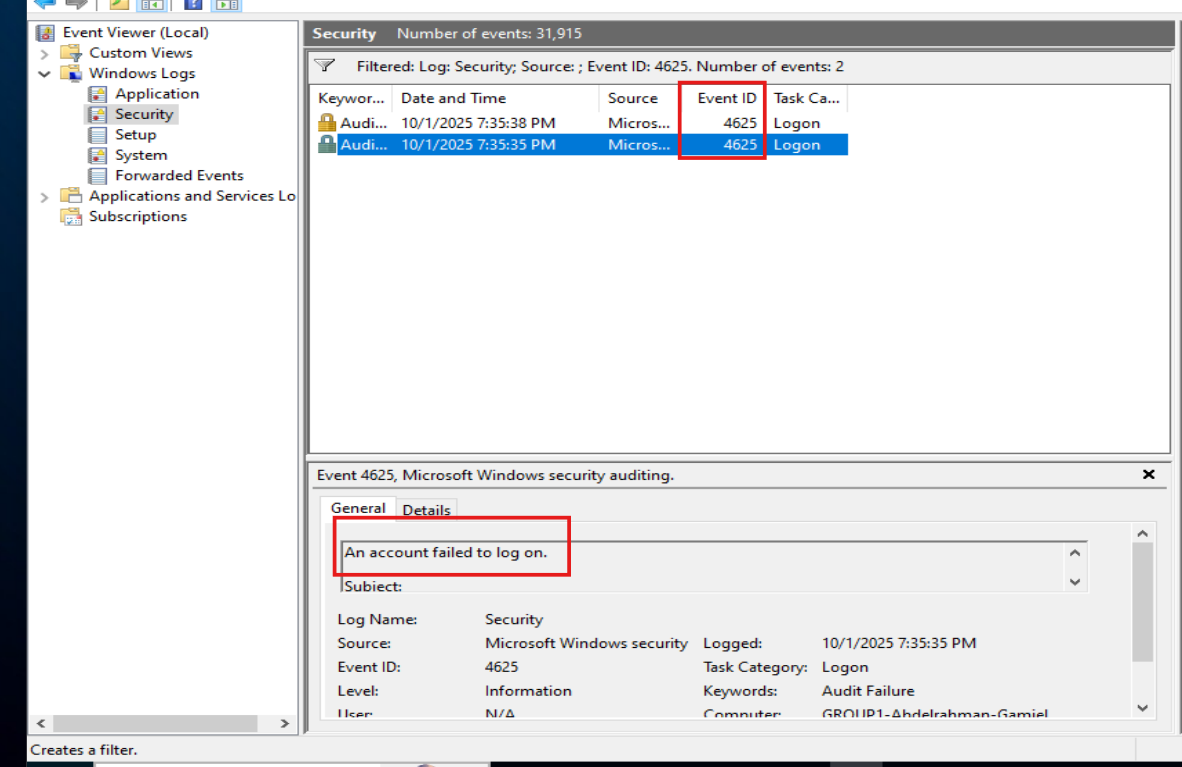
After enabling the required audit policies, we can open Event Viewer and check Security logs to make sure the system is generating the expected events—such as successful logon (Event ID 4624) and failed logon attempts (Event ID 4625), Once we confirm these events are appearing locally, we can proceed to use Winlogbeat to collect and send them to Elasticsearch, as we can see below :
Next, we need to configure the winlogbeat.yml file , In this file, we define the event logs that Winlogbeat will monitor ,such as Security, System, and Application ,and we set the output section to point to our Elasticsearch server and kibana same as in filebeat so the logs can be forwarded correctly as we can see below :
first, we define the event logs that winlogbeat will monitor 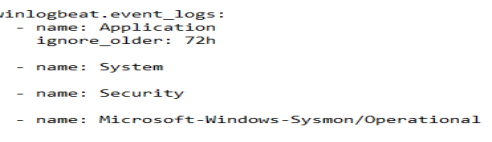
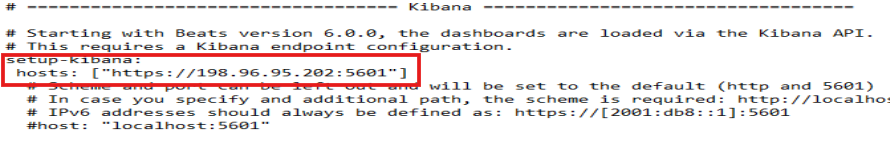
then, we set the output section to the IP of our Elasticsearch that changed to 192.96.95.202 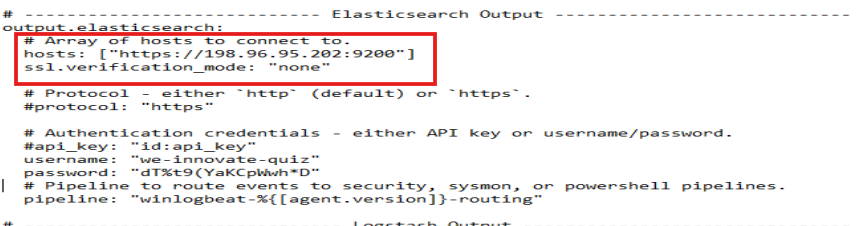
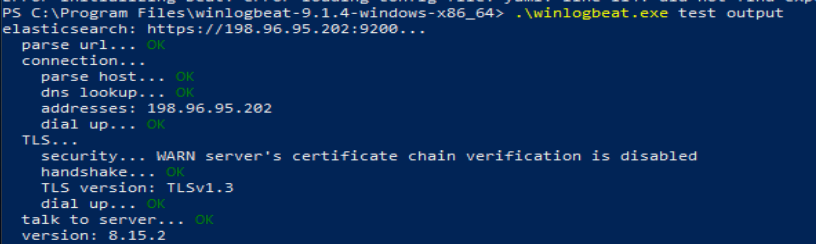
“After configuring the file, we need to open the powershell as adminstrator to validate the connection using the command .\winlogbeat.exe test output , which confirms whether Winlogbeat is able to communicate with the Elasticsearch instance as we can see below all things is OK :
“Then we can preview the logs in PowerShell before sending them to Elasticsearch by running:
.\winlogbeat.exe -c .\winlogbeat.yml -e This command displays the logs in the terminal so we can verify that Winlogbeat is collecting and processing them correctly as we can see below: 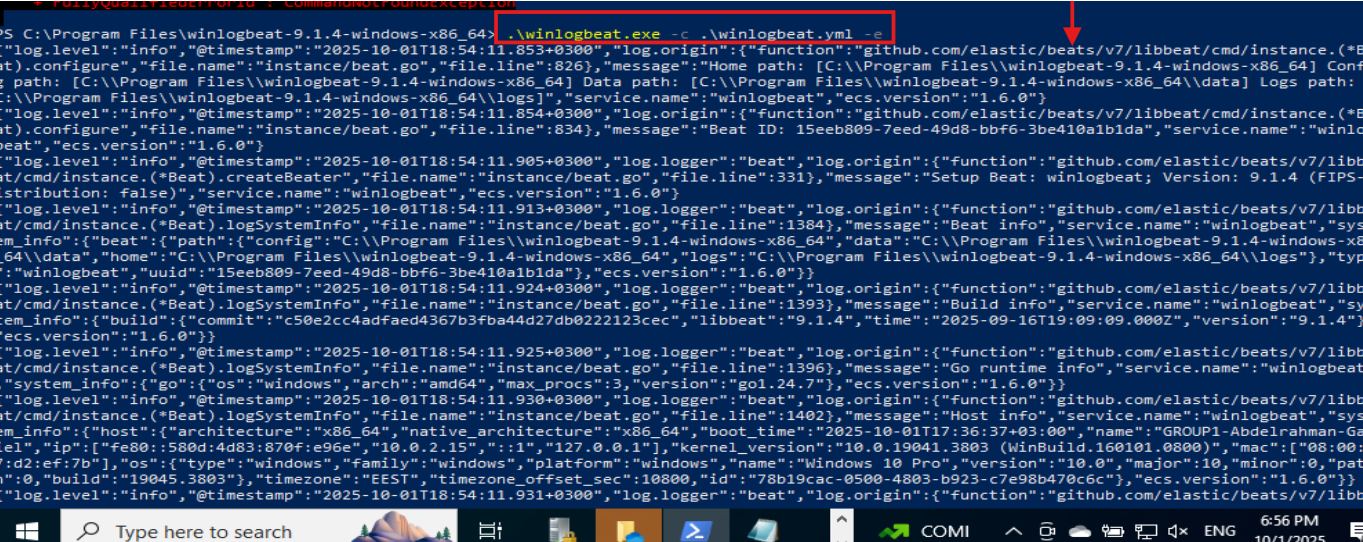
Now we can go to Elasticsearch (Kibana) and search using the hostname of our machine to confirm that the logs were successfully sent as we can see below that we can find the logs of our machine : 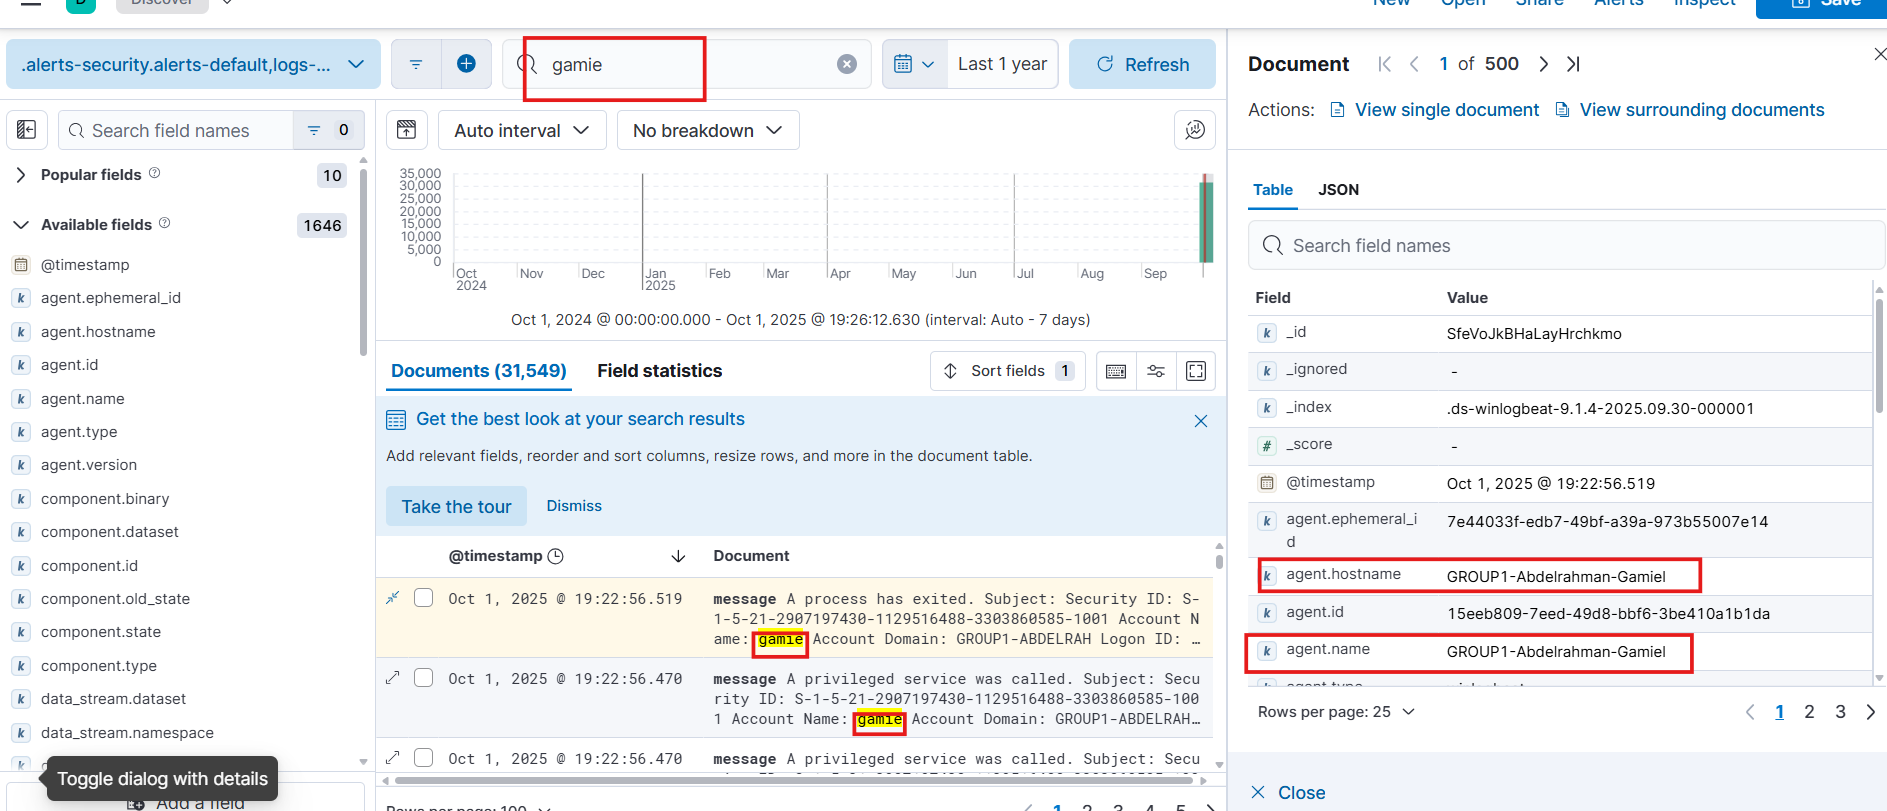
Also, we can search by Event IDs to check the audit policies. For example, searching for Event ID 4625, which is related to failed logon attempts, allows us to confirm that these events are being collected as we can see below : 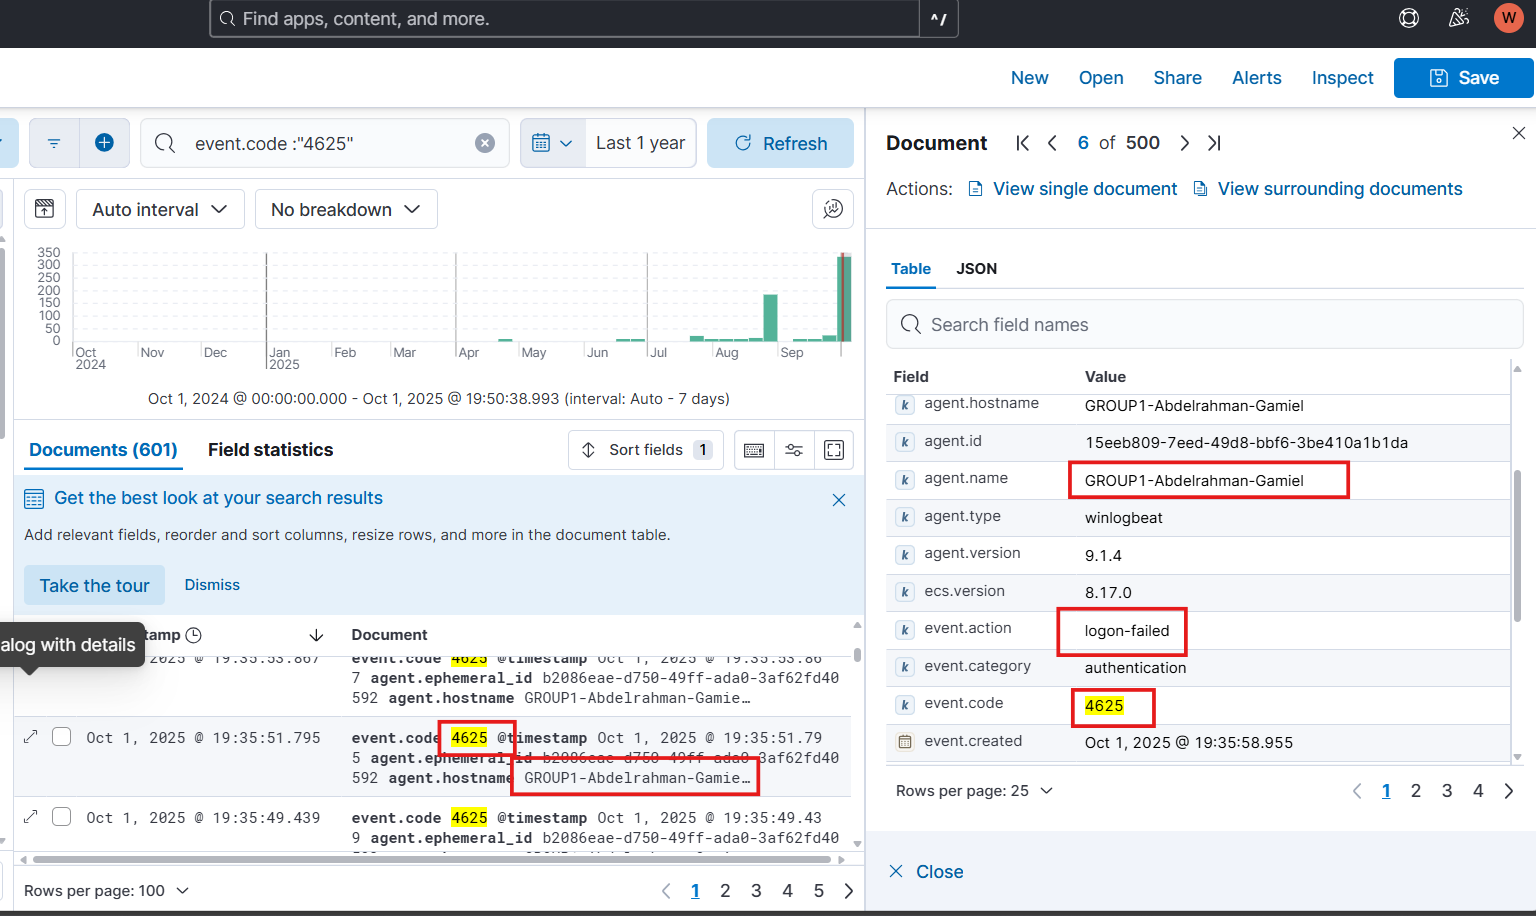
Now, we can see that everything is working correctly, and the machine logs were successfully sent to the SIEM (Elasticsearch). We can easily view, analyze, and monitor these logs through Kibana.
Setting up Fluent Bit to send logs to Elasticsearch from machines
Now, we will start setting up Fluent Bit to collect and forward logs from our system to Elasticsearch. Fluent Bit is a fast, lightweight, and highly efficient log processor and forwarder that can collect logs from multiple sources and send them to Elasticsearch for indexing and analysis.
Fluent Bit allows you to:
Collect logs from various sources such as files, systemd/journald, applications, and custom log paths.
Parse, filter, and enrich logs before forwarding them.
Forward logs securely to Elasticsearch, SIEM platforms, or other destinations.
Integrate seamlessly with Elasticsearch and Kibana for visualization, monitoring, and correlation.
Minimize resource usage thanks to its extremely lightweight design, making it ideal for servers, endpoints, and cloud environments.
To set up Fluentbit, we need to install it on the Windows machine, configure its YAML file, and connect it to our Elasticsearch instance to start sending event logs
- In our case, we will configure Fluent Bit to collect logs from a specific file that contains WAF (Web Application Firewall) logs, then forward these logs to Elasticsearch for further analysis and monitoring.
Install Fluentbit for windows and send Logs to Elasticsearch you can visit the original documentation of deploying and Install:
First, we need to Download Fluentbit Files on our machine from the previous Link Download Fluent bit then Choose the package based on your machine, Here, in our case, we will send the logs from a file on an 64x windows machine, so we will choose the package type windows then choose fluent-bit-4.2.0-win64.exe, and then proceed with the download and installation steps.
Then, after the installation and Before setting up and configuring Fluentbit, we need to make a Regex parser: We need to created a Regex Parser in Fluent Bit to read the WAF log file, This parser helps Fluent Bit extract important fields like timestamp, IP, request method, URI, status code, and any message in the log .
The sample of the WAF logs that we want to create a regex for and send to Elasticsearch is:
1
2
3
4
5
6
7
8
9
10
11
    - date=2025-02-24 time=14:47:05 devname="FORTIGATE-02" devid="FGT90D4H56789012" logid="0210000000" type="utm" subtype="virus" eventtype="infected" level="critical" vd="root" policyid=18 sessionid=5632789 srcip=192.168.8.20 srcport=50123 dstip=103.143.230.162 dstport=80 srcintf="internal" dstintf="wan1" service="HTTP" hostname="suspicious-files.net" profile="AV-High-Security" direction="outgoing" virusname="Trojan.GenericKD.45321" action="blocked" msg="Malware detected and blocked"


   - date=2025-02-24 time=15:10:33 devname="FORTIGATE-01" devid="FGT90D3G12345678" logid="0210000001" type="utm" subtype="virus" eventtype="infected" level="high" vd="root" policyid=22 sessionid=8745123 srcip=192.168.6.45 srcport=55122 dstip=188.168.12.14 dstport=443 srcintf="internal" dstintf="wan1" service="HTTPS" hostname="compromised-updates.com" profile="AV-Security" direction="outgoing" virusname="Backdoor.Win32.DarkKomet" action="blocked" msg="Malware download attempt prevented"


   - date=2025-02-24 time=16:30:15 devname="FORTIGATE-01" devid="FGT90D3G12345678" logid="0210000004" type="utm" subtype="virus" eventtype="infected" level="high" vd="root" policyid=17 sessionid=6458392 srcip=192.168.1.35 srcport=50211 dstip=192.0.2.55 dstport=80 srcintf="internal" dstintf="wan1" service="HTTP" hostname="malicious-updates.net" profile="AV-Standard" direction="outgoing" virusname="Win.Trojan.Agent-9876" action="detected" msg="Malware detected but not blocked"


   - date=2025-02-24 time=18:15:22 devname="FORTIGATE-04" devid="FGT1234567XYZ" logid="0210000008" type="utm" subtype="virus" eventtype="infected" level="critical" vd="root" policyid=19 sessionid=7856432 srcip=10.50.3.15 srcport=50987 dstip=218.78.132.164 dstport=80 srcintf="internal" dstintf="wan1" service="HTTP" hostname="officeupdates-fake.com" profile="AV-Enterprise" direction="outgoing" virusname="Trojan.Macro.Dropper" action="blocked" msg="Malicious macro detected in document
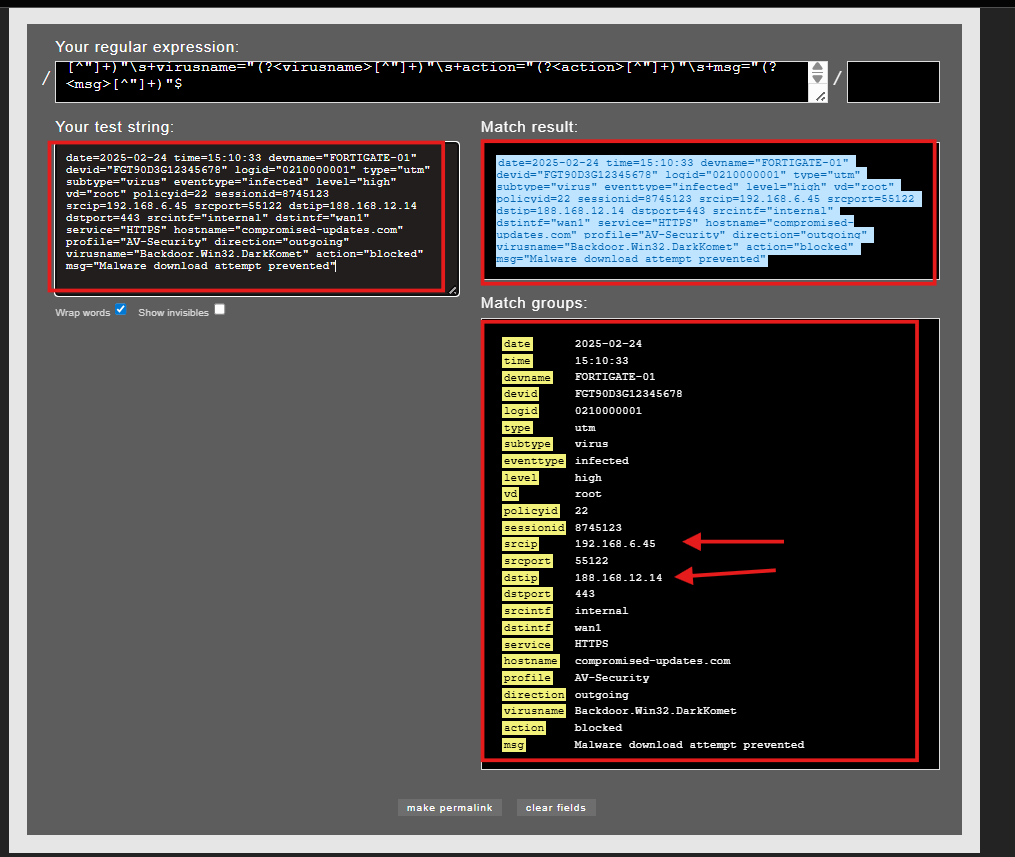
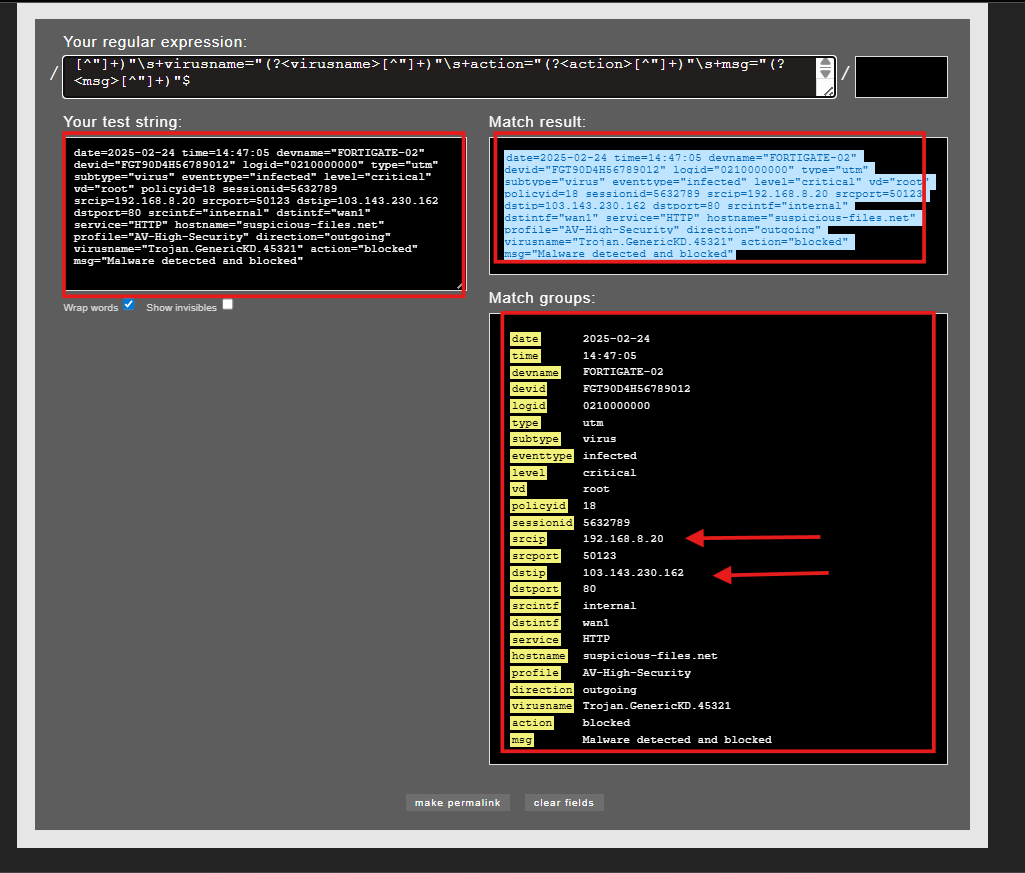
Then we can create the Regex by using Rubular web site that is Ruby regular expression editor : Rubular
then we can use this regex for our waf logs to extract imporant fields : ^date=(?<date>\d{4}-\d{2}- \d{2})\s+time=(?<time>\d{2}:\d{2}:\d{2})\s+devname="(?<devname>[^"]+)"\s+devid ="(?<devid>[^"]+)"\s+logid="(?<logid>[^"]+)"\s+type="(?<type>[^"]+)"\s+subtype="( ?<subtype>[^"]+)"\s+eventtype="(?<eventtype>[^"]+)"\s+level="(?<level>[^"]+)"\s+ vd="(?<vd>[^"]+)"\s+policyid=(?<policyid>\d+)\s+sessionid=(?<sessionid>\d+)\s+sr cip=(?<srcip>\d{1,3}(?:\.\d{1,3}){3})\s+srcport=(?<srcport>\d+)\s+dstip=(?<dstip>\d {1,3}(?:\.\d{1,3}){3})\s+dstport=(?<dstport>\d+)\s+srcintf="(?<srcintf>[^"]+)"\s+dsti ntf="(?<dstintf>[^"]+)"\s+service="(?<service>[^"]+)"\s+hostname="(?<hostname>[ ^"]+)"\s+profile="(?<profile>[^"]+)"\s+direction="(?<direction>[^"]+)"\s+virusname ="(?<virusname>[^"]+)"\s+action="(?<action>[^"]+)"\s+msg="(?<msg>[^"]+)"$
then we can match this regex with our sampled WAF logs to extract fields such as src and dis IPs as we can see below :
Then we should create a file for these parsers, add the regex to it, and name it, for example: firewall.conf and be careful of it path as we can see below : 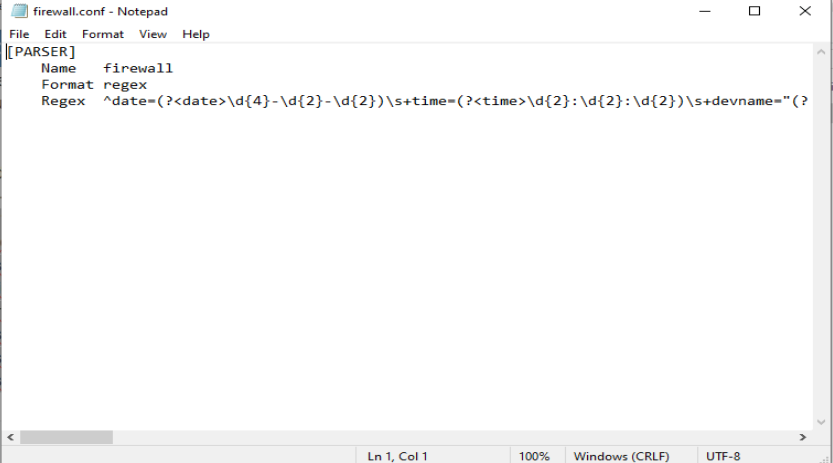
Then we need to configure fluent-bit.conf which defines how Fluent Bit loads parsers, reads log files, and sends the processed logs to Elasticsearch. The configuration contains three main sections so it can load these parsers and forward the logs to Elasticsearch as we can see below: 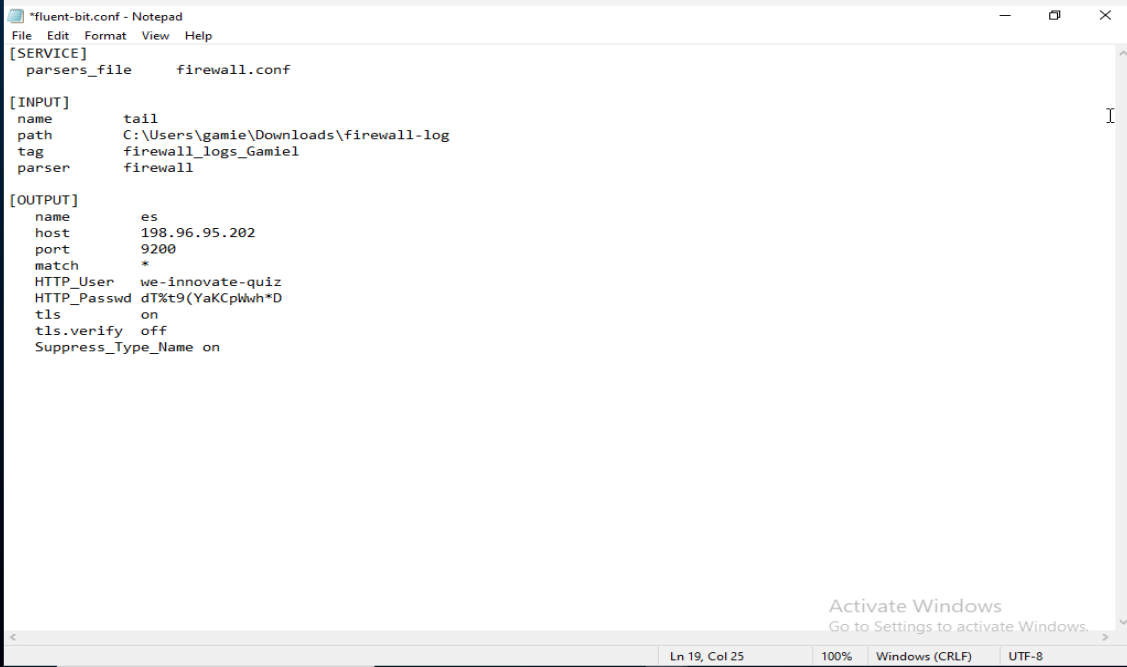
The SERVICE section loads the external parsers file.
Here, Fluent Bit is instructed to load the file
firewall.conf, which contains the custom regex parser that we just created it on rubularfor the WAF logs.Without this line, Fluent Bit would not be able to use the parser we created.
- The INPUT Section This section configures how Fluent Bit reads the logs
- name
tail: Fluent Bit will monitor (tail) a log file continuously using when you need to collect the logs from a file , meaning it reads new lines as they are added path: Specifies the exact location of the WAF log file on the Windows machine (careful with the right path!!!!) such as :
C:\Users\gamie\Downloads\firewall-log- tag: Gives a custom tag to the logs (useful for filtering/matching in the output) such as Here the tag is:
firewall_logs_Gamiel - parser firewall:Tells Fluent Bit to apply the regex parser named
firewall(defined earlier infirewall.conf) to correctly extract fields from each log line.
- name
- The OUTPUT Section This section defines where Fluent Bit will send the processed logs — in this case, Elasticsearch
- name
es:That Fluent Bit will use the Elasticsearch output plugin - host:The IP address of the Elasticsearch server such as
198.96.95.202 - port
9200:Default Elasticsearch port - match
*:Sends all logs (from all tags) to Elasticsearch,The * wildcard ensures the firewall logs are included. - HTTP_User / HTTP_Passwd: Authentication credentials for Elasticsearch .
- tls
on: Enables secure communication (HTTPS). - tls.verify
off:Disables certificate verification — used when Elasticsearch has a self-signed certificate. - Suppress_Type_Name
on:Avoids adding a _type field in the output index
- name
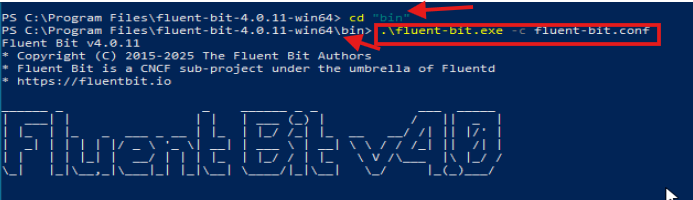
after we have finished all these configurations Run the PowerShell as an adminstrator to excute these configurations by make change directory “cd” to “bin” files and use this command “.\fluent-bit.exe -c fluent-bit.conf.conf” as we can see below :