Installing the SNORT and Setting up as a IDS and create custom Rules to detect Activities

Lab Introduction:
What is SNORT ?
SNORT is a powerful open-source intrusion detection system (IDS) and intrusion prevention system (IPS) that provides:
- real-time network traffic analysis and data packet logging.
- SNORT uses a rule-based language that combines anomaly, protocol, and signature inspection methods to detect potentially malicious activity.
- Using SNORT, network admins can spot:
- denial-of-service (DoS) attacks and distributed DoS (DDoS) attacks
- Common Gateway Interface (CGI) attacks,
- buffer overflows, and stealth port scans.
- SNORT creates a series of rules that define malicious network activity, identify malicious packets, and send alerts to users.
- SNORT is a free-to-use open-source piece of software that can be deployed by individuals and organizations.
- The SNORT rule language determines which network traffic should be collected and what should happen when it detects malicious packets: This snorting meaning can be used in the same way as sniffers and network intrusion detection systems to discover malicious packets or as a full network IPS solution that monitors network activity and detects and blocks potential attack vectors.

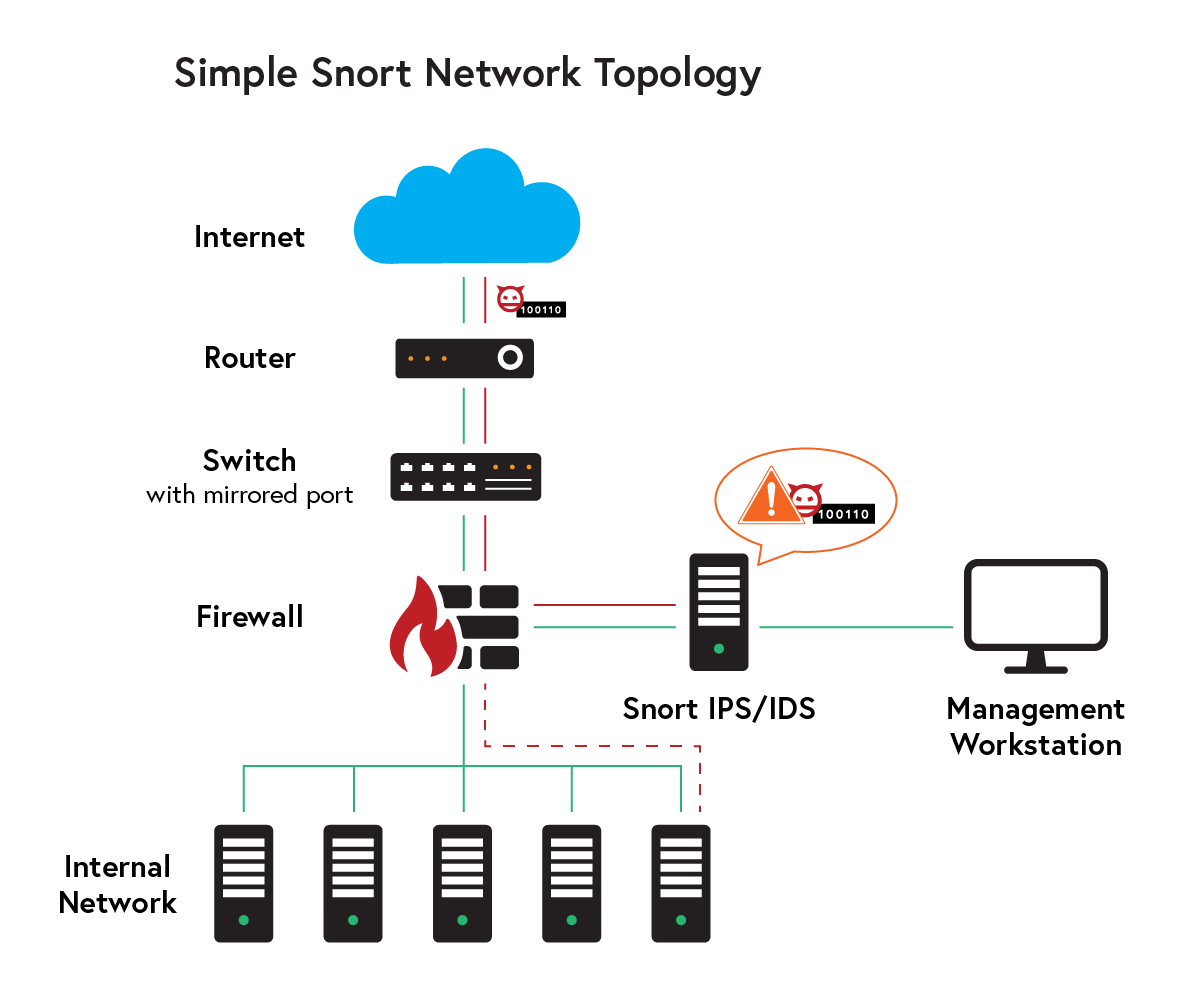
Network Architecture with SNORT:
In this lab
we will deploy and configure
Snort as an Intrusion Detection System (IDS)to monitor and analyze network traffic. We will create and test custom Snort rules to detect different types of Nmap scanning techniques and others. By generating traffic from another machine and capturing it with Snort, we willdetect real-time alertsand understand how IDS signatures work. This exercise helps build practical skills in network security monitoring, intrusion detection, and incident analysis.
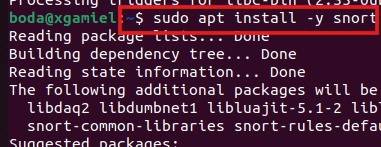
First, we will install the SNORT in our Machine by command: “ sudo apt install -y snort “ then the snort will be installed:
After installation you should choose the configuring snort and address range for the local network that as we can see below: 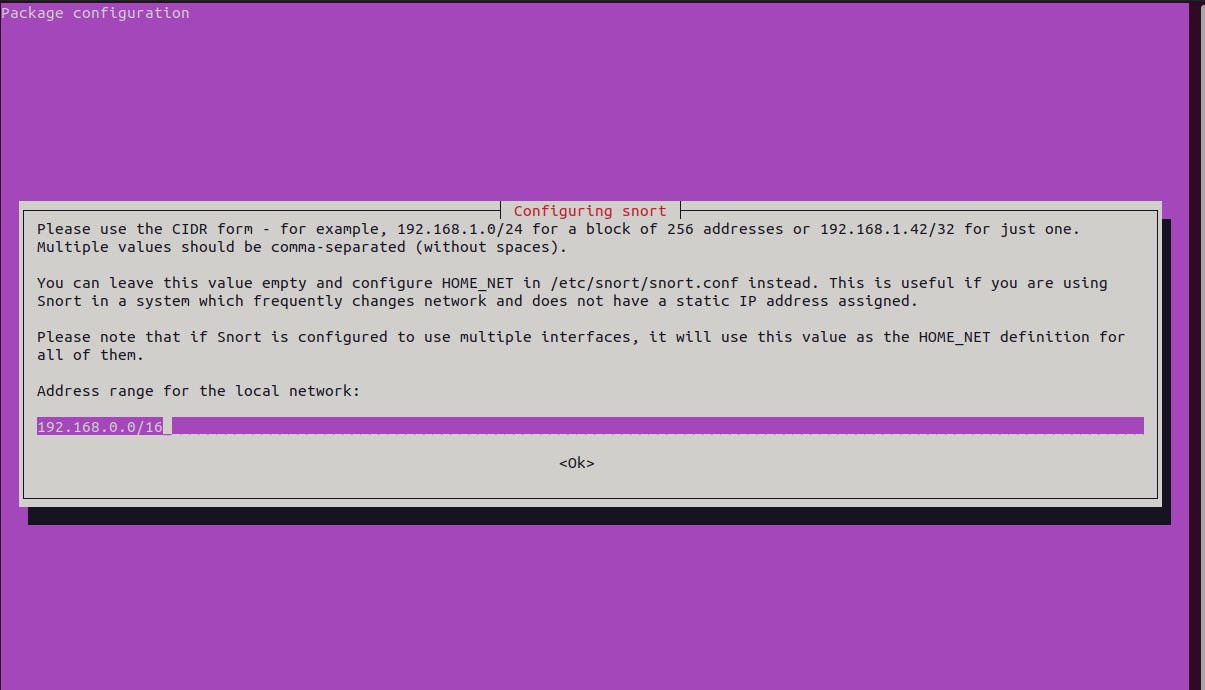 Then we need to know what is the interfaces and the IP address of snort machine by the command :
”ip a” as we can see below : 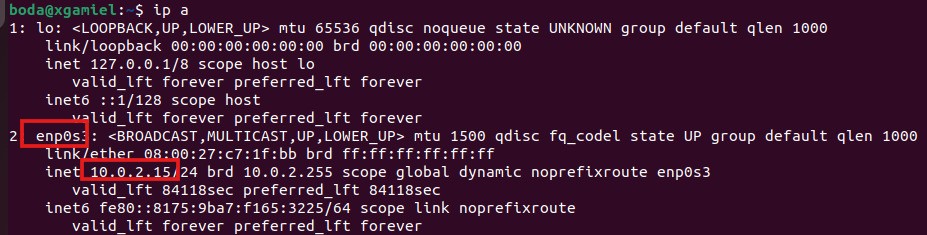
NOTE!!
after that this ip will be changed to “192.168.56.107” to connect it to other machine”192.168.56.103” in same network to execute activities to chek the how snort is working
Then we need to set up the configurations of the snort we can do that in the file of configurations by the command : “sudo nano /etc/snort/snort.conf or can meke change directory(CD) to the “cd /etc/snort “then excute “sudo nano snort .conf “ as we can see blow :

Then in this file we will check and create some configurations First assign the range of network IPs of machine to $HOME_NET variable and assign “any” to $EXTERNAL_NET variable as we can see below : 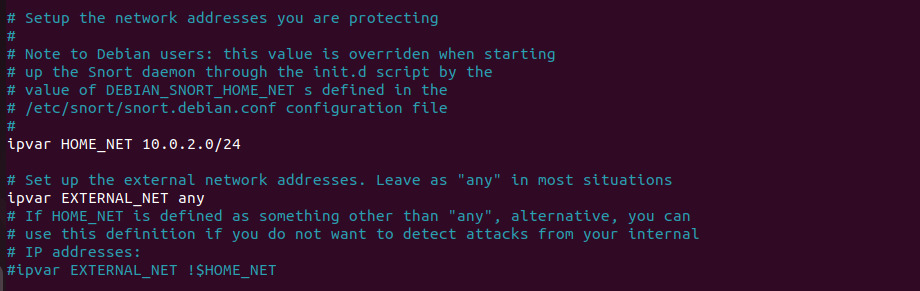
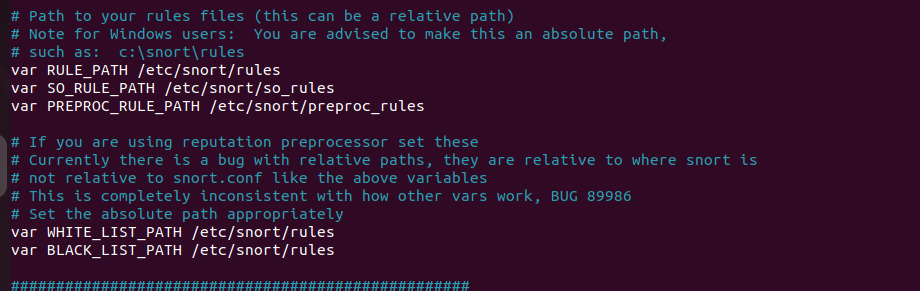
Next in the same file snort.conf, verify that the paths of the rule files are correct. They should appear as shown below:
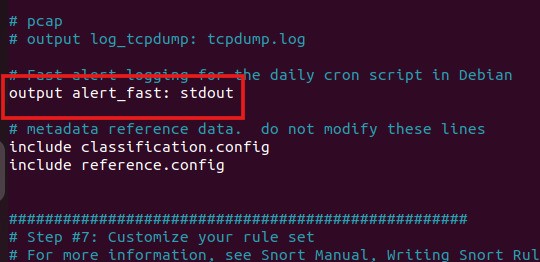
in the same file, check the output alerts path and change it to “stdout” to directily output on the consle as we can see below :
Next, verify the path of the specific rules and ensure they are placed in the “local.rules” file as shown below:
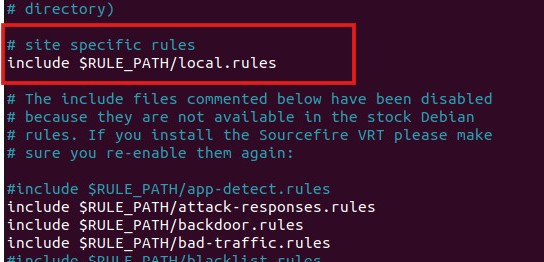
Then we need to create and configure some specific and custom rules for our Snort IDS to detect the attack. We can do that by editing the local.rules file using the command sudo nano /etc/snort/rules/local.rules, and then adding your specific rules as shown below:

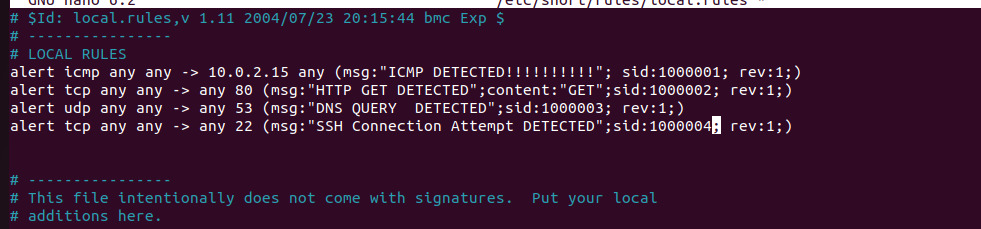
Next, we create our custom rules in this file. Below are some of the rules that I have created:
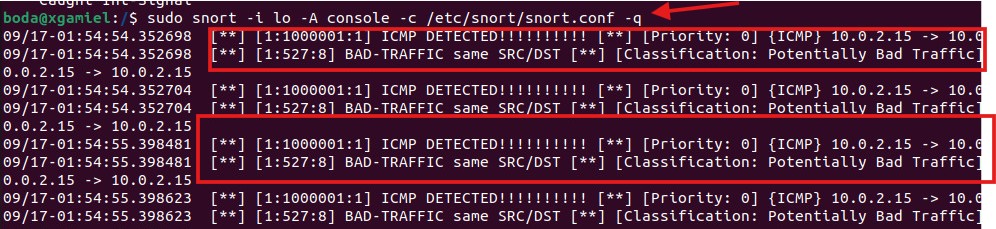
when save the rules and exit. To make Snort work as an IDS and detect alerts when we test the rules, we can use the following command: sudo snort -i lo -A console -c /etc/snort/snort.conf -q
We choose the “lo” interface because we are testing the rules on the same machine where Snort is installed.

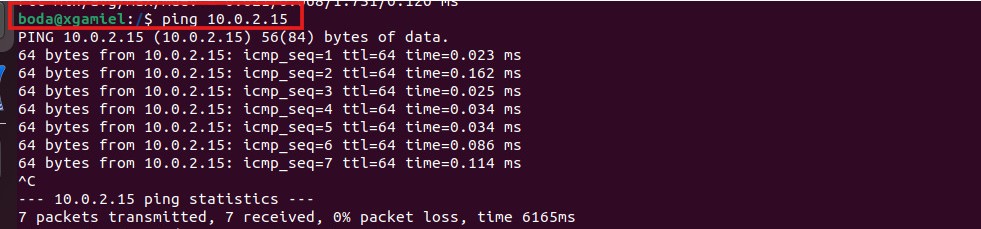
Now we can test, for example, the first rule for “ICMP ping detection” by using the command:
ping + <ip_of_the_machine> as we can see below:
Then we check the Snort IDS to see the detection alerts of this test, as shown below:
We can also test another rule — for example, the last rule that detects SSH connections.
In this case,
we need to change the default IP address and network interface, since we are performing the test from another machine on the network.
The command to run Snort as an IDS will be:
sudo snort -i enp0s3 -A console -c /etc/snort/snort.conf -q
Here, the interface is changed to“enp0s3”, and the IP address of the machine is set to“192.168.56.107”.
- Then we can test the SSH connection using the following command from another machine:
ssh user@ip_of_machine

Then we check the Snort IDS to see the detection alerts of this test,
As we can see below, Snort detects this SSH connection based on the custom rule:

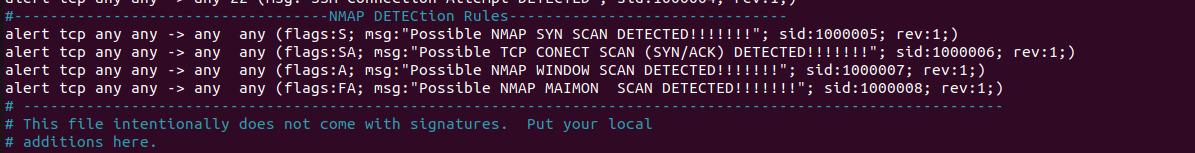
We can also add specific rules to detect different types of Nmap scans. We add these rules to the local.rules file, as shown below:
Then we test it from another machine and check the Snort alerts. We also sniff the traffic using Wireshark.
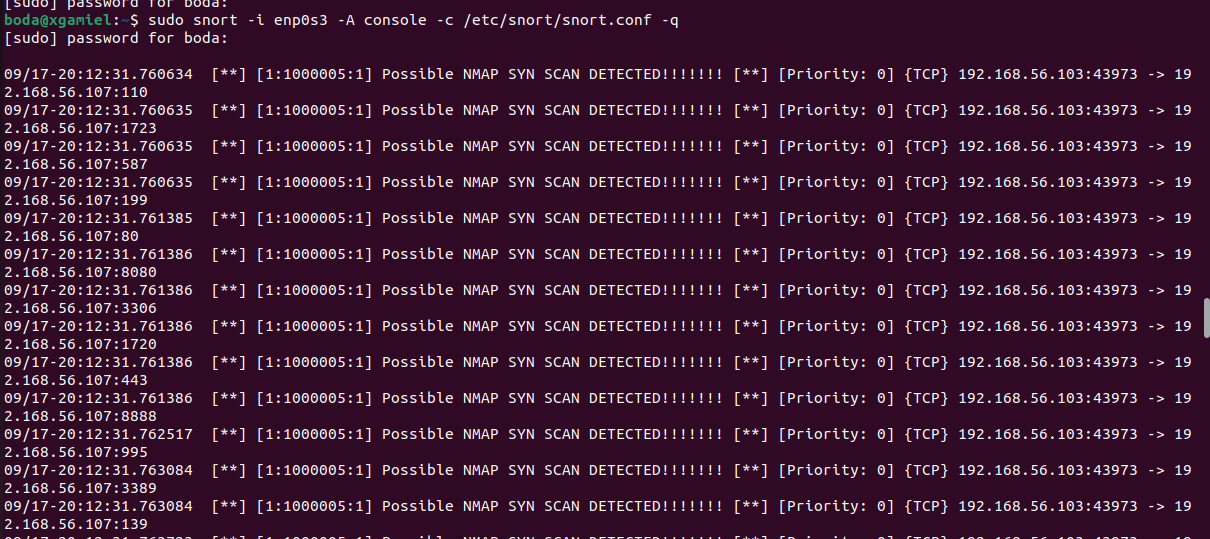
For example, we can test the first rule that is specified for detecting a SYN scan by running the following command from another machine: nmap -sS <ip_of_machine>

Then we check the Snort IDS to see the detection alerts of this test,
As we can see below, Snort detects this SYN Scan based on the custom rule:
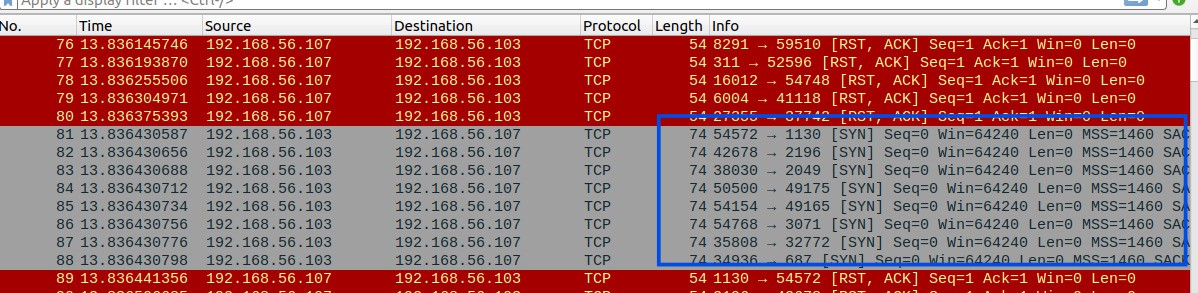
Then we check the Wireshark traffic to observe the abnormal number of SYN scan packets, and we can clearly see them as shown below:
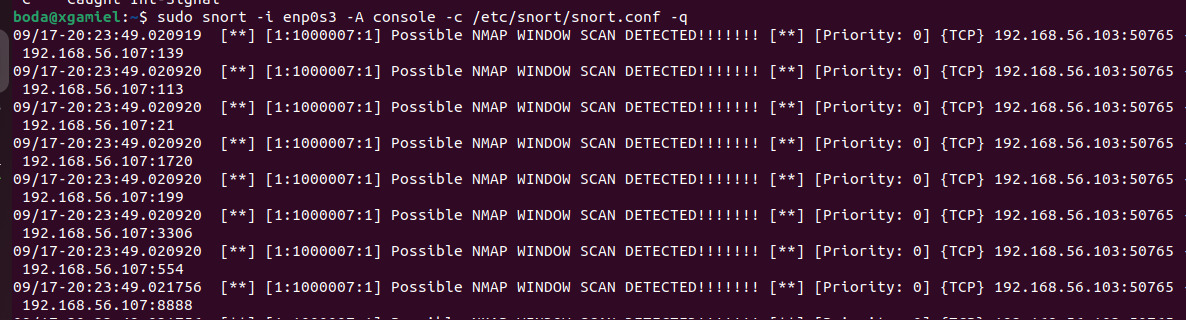
We can test the rule that is specified for Window scans by running:
nmap -sW <ip_of_machine> from another machine.

Then we check the Snort IDS to see the detection alerts of this test,
As we can see below, Snort detects this Window Scan based on the custom rule:
Then we check the Wireshark traffic to observe the abnormal number of ACK packets, and we can clearly see them as shown below:
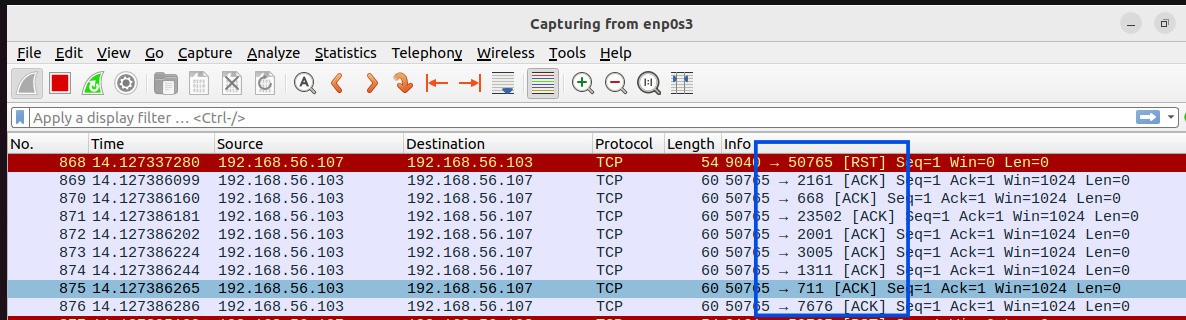
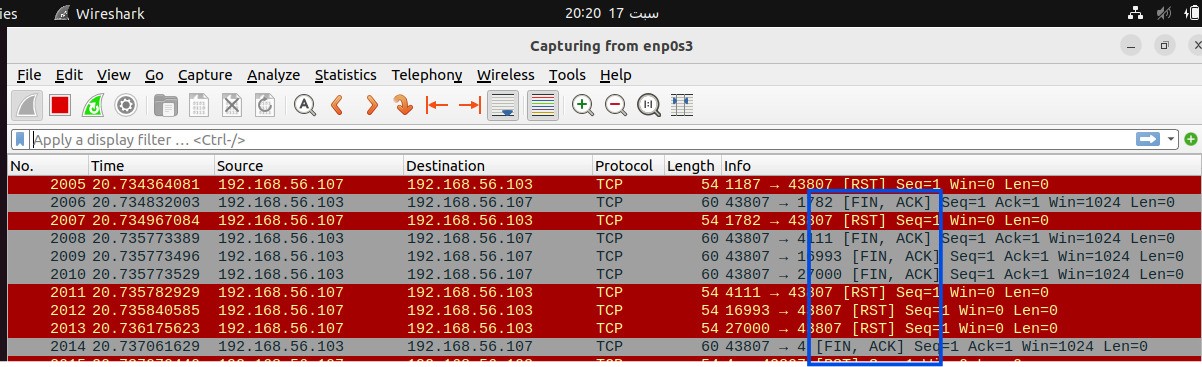
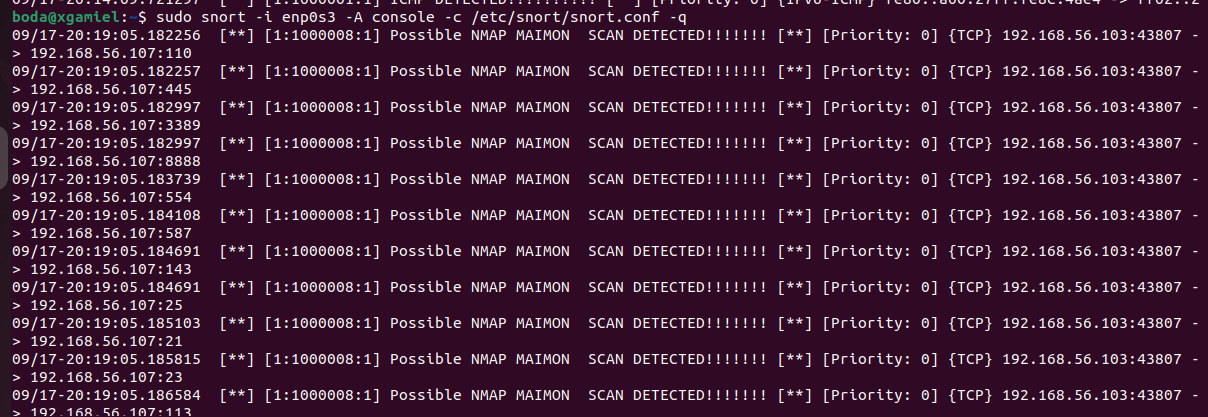
also, We can test the rule that is specified for MAIMON scans by running:
nmap -sM <ip_of_machine> from another machine.

Then we check the Snort IDS to see the detection alerts of this test,
As we can see below, Snort detects this MAIMON Scan based on the custom rule:
Then we check the Wireshark traffic to observe the abnormal number of "FIN- ACK" packets, and we can clearly see them as shown below: